As New England digs out from a historic blizzard, today’s post takes a deep and technical dive into recent research — Chen et al. 20251 — claiming that Nor’easters have become detectably more intense over recent decades. That research asserts,
Our analysis of nor’easter characteristics reveals that the strongest nor’easters are becoming stronger . . .
Taking advantage of AI tools, I have replicated and extended the analysis. As is far too common in high profile climate research, the top-line claims of the paper do not survive scrutiny. Public commentary by the paper’s senior author and subsequent media reporting provide a case study in how uncertain and ambiguous findings are turned into strong claims expressed with absolute certainty.
Grab your coffee, settle in and let’s take a deep dive. Last July, a paper in PNAS by Chen and colleagues was accompanied by widespread media coverage claiming that the new paper was the first and last word on trends in the intensification of nor’easters. For example:
- Live Science reported that nor’easters “have become 20% more destructive in the last 80 years.”
- Inside Climate News declared that “the strongest ones are clearly getting stronger.”
- The Weather Network, revisiting the study in December, announced that nor’easters are “growing more intense and producing more rain and snow than ever before.”
- The University of Pennsylvania’s press release on the paper called its findings “unquestionable.”
- Michael E. Mann, the paper’s senior author and a climate scientist at the University of Pennsylvania, in his accompanying blog post, stated that intensification “can now be seen in the observations.”
A closer reading of the paper shows that none of the above claims are a true reflection of what the paper actually says, supported by a simple extension of its methods and analysis.
Nor’easters are among the most consequential weather events affecting the densely populated U.S. East Coast, into New England and the Canadian maritime provinces. If the most intense storms have become detectibly more intense, and are expected to continue to do so, that has important implications for urban planning and decision making in other settings.
The bottom line: Chen et al. take on a worthwhile question but its headline claims, and those that followed publication, go meaningfully beyond what the data can currently support. Follow-on public discussion by its senior authors and in the media depart even further from what evidence and analysis can support. Worthwhile findings of uncertainty and ambiguity are transformed into unquestioned certainty in support of a narrative that everything is getting worse.
What Chen et al. did and what they found
Chen et al. use ERA5 — the European Centre for Medium-Range Weather Forecasts’ global reanalysis — to construct a historical record of nor’easters from 1940 to 2025. A nor’easter is a powerful, large-scale low-pressure storm system, called an extratropical cyclone (ETC), that forms along the east coast of North America, characterized by winds blowing from the northeast (giving such storms their common name), often accompanied by heavy rain or snow.
A reanalysis can be understood as a retrospective weather forecast: historical weather observations — from sources such as weather balloons, ships, land stations, and eventually satellites — are fed into a numerical weather model to reconstruct the historical state of the global atmosphere.
Ideally, the result is a consistent, gridded dataset of weather variables covering the entire planet, filling in gaps where direct observations were never made. ERA5 is the most widely used reanalysis in climate research. As we will see, going back further in time, reanalysis quality is far from uniform, and the creators of such datasets are warn about its use for long-term trend analyses.
Using the ERA5 reanalysis, Chen et al. identify 900 storms from 1940 to 20242 that meet their criteria for an ETC. With this time series they apply a statistical technique called quantile regression to explore whether the intensity of the strongest ETCs has changed over time.
Quantile regression allows for a focus on extremes rather than just averages, enabling quantification of whether, for instance, the intensity of the top 10%, top 5%, or top 1% of storms have detectably changed over time.
Chen et al. report that from 1940–2025 record, the peak wind speeds of the most intense nor’easters — those in the top 1% (that is, about 9 storms) — increased by approximately 6%, from ~31 m/s (~69 mph) at the start of the record to ~33 m/s (~74 mph) by its end. The trend for the top quarter of storms (75th percentile and above) is similar in magnitude.
The authors then apply a damage-scaling relationship to translate this wind speed increase into a headline impact figure: asserting that economic loss potential is proportional to the cube of wind speed. They assert that a 6% increase in peak winds implies a ~20% increase in destructive power (see Pielke 2007 for a discussion of the sensitivity of damage estimates to assumptions about wind-damage scaling exponents).
The math is straightforward. Whether the underlying 6% increase in peak wind speed trend is real and “unquestionable,” however, does not stand up to scrutiny.
The paper also includes a very useful supplementary analysis: It includes a test of whether the results of 1940-2024 hold up when restricted to the era when data from satellites was systematically available (1979–2024). The satellite era is the period when global weather observations, and thus global reanalysis, became far more comprehensive and reliable, as described in a recent overview — The ERA5 global reanalysis from 1940 to 2022.
The supplementary analysis to Chen et al. includes information that dramatically undercuts the headline findings that were picked up and amplified by the media.
What the PNAS Supplementary Analysis to Chen et al. actually shows
A close look at the supplementary analysis reveals results that depart from the paper’s headline results.
Specifically, the satellite-era analysis (1979-2024) does show nominally significant trends — but they are concentrated in the 60th to 78th percentile range of storm intensity, not at the extreme tail, as claimed in the main body of the text.
For the very strongest storms (95th and 99th percentiles) that Mann’s post-publication blog post emphasizes, the satellite-era statistical significance does not reach conventional thresholds of significance. That means that the paper’s headline — the strongest storms getting stronger — is least well supported in the most trustworthy portion of the dataset of the satellite observational era.
In the paper, the authors emphasize a sensitivity analysis that starts their analysis in 1950 rather than 1940 — trimming just a single decade from the pre-satellite period. But even in this alternative analysis, statistical significance almost completely disappears across the distribution, as you can see in the image below.
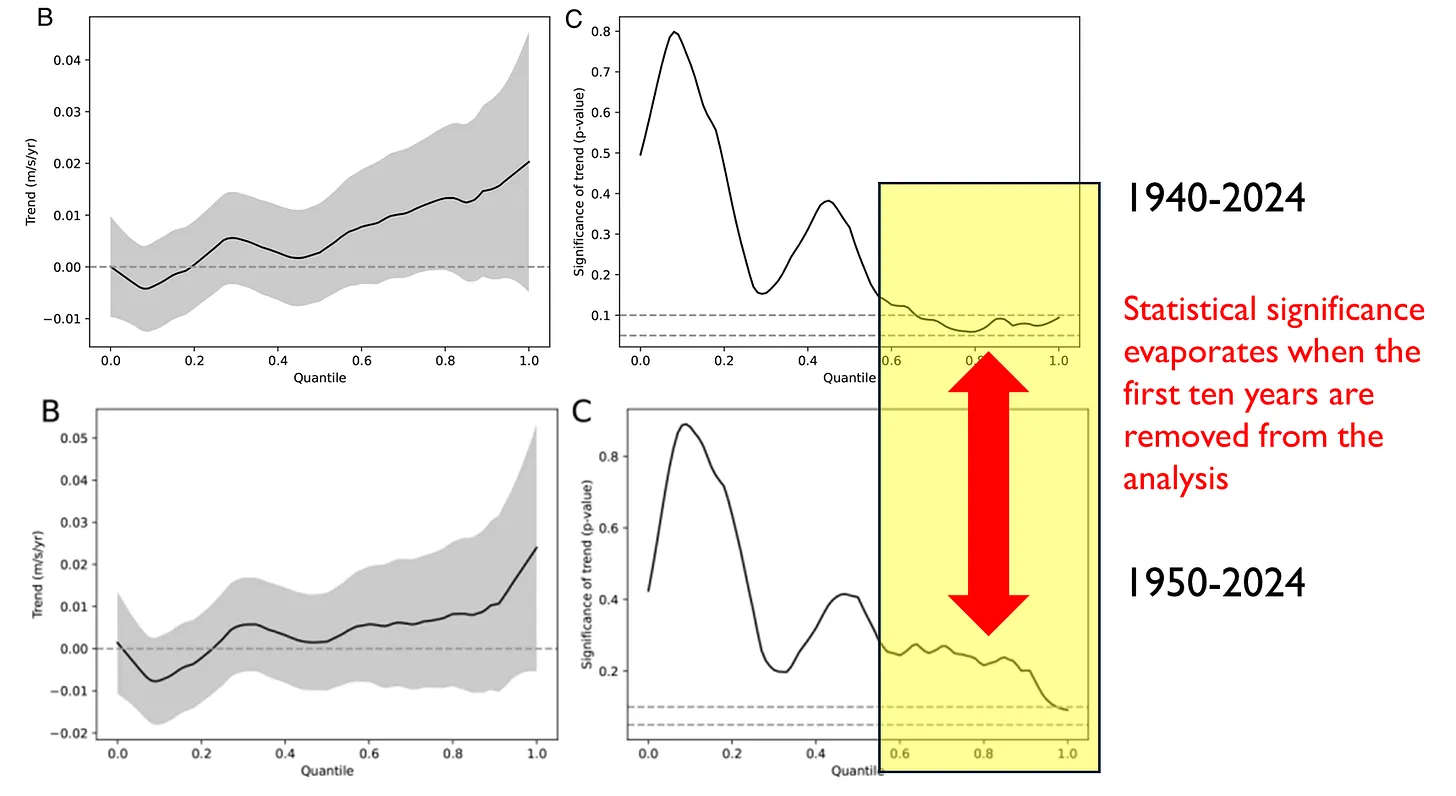
The sensitivity analysis clearly indicates that one decade of early, sparse data is doing an enormous amount of work in generating the headline result. This inconvenient information is reported in the supplementary material but not discussed in the paper, in the university press release, or the senior author’s blog post on the paper. But that is just the start of problems with the headline results
The ERA5 Problem
As a model-based reconstruction of the atmosphere that incorporates historical weather observations, ERA5 does not incorporate a uniform observational record over time.
The number and quality of those observations has changed dramatically over time. For instance, in 1940, ERA5 was working with roughly 17,000 global observations per day, almost entirely from land stations and ships, with virtually no coverage over the open ocean. By 2022, that number had grown to 25 million observations per day, with global satellite coverage providing near-complete atmospheric profiles worldwide. The preliminary back-extension to 1950 was released with explicit caveats about uncertainties and cautions about its use in research.
Logically, any reanalysis that is data-sparse over the ocean over the 1940s to 70s and data-rich from 1979 onward will tend to show apparent improvement in storm intensity over time, partly reflecting improved data coverage rather than real changes in storm behavior.
Independent validation studies confirm that ERA5 systematically underestimates wind speeds within extratropical cyclone centers, with elevated errors near the storm core and in the Gulf Stream region where nor’easters intensify most explosively. Other research suggests that biases in intensity estimates of the top 5% most extreme ETCs may be a negative bias of ~10%, with ERA5 performance deteriorating further for local extreme values within storms — the events at the focus of Chen et al..
Chen et al. does not engage with any of this literature.
To put these uncertainties in concrete terms: The paper’s headline finding is a ~6% increase in peak wind speeds over 85 years, corresponding to a trend of roughly 0.2 m/s per decade at the 99th percentile. ERA5’s known negative bias for extreme extratropical cyclone winds is ~10% — and that bias is not constant over time.
Again logically, because ERA5 is data-sparse over the western Atlantic in the early decades and data-rich after 1979, the reanalysis almost certainly underestimates early-record wind speeds more severely than late-record ones. That means that any improvement in observational coverage from 1940 to 2025 could generate a spurious apparent trend of comparable magnitude to the claimed signal detected in Chen et al..
This does not mean the asserted trend detected by Chen et al. is necessarily an artifact of observational system and coverage changes. But it does mean the reanalysis data cannot currently be used to distinguish a real trend from a measurement artifact. That itself is an important and worthwhile finding, even if not ready made for climate headlines.
That brings us to the importance of rigorous standards for detection and attribution, as established by the Intergovernmental Panel on Climate Change (IPCC).
Chen et al. in context of the IPCC framework for detection and attribution
Whether ETCs have increased in intensity on climate timescales is ultimately a detection and attribution question: Has a change in the statistics of ETCs been detected in nor’easter intensity? If so, then we next ask about attribution: Can a detected change be attributed to human or natural factors, or perhaps both?
Achieving detection and/or attribution requires a robust evidence base, including: multiple independent datasets, multiple methods, often reinforced by earth system model simulations that can reproduce the observed change through known mechanisms.
Let’s review what AR6 actually says about extratropical cyclones. On past changes, AR6 Chapter 11 is explicit:
“There is low confidence in past changes of maximum wind speeds and other measures of dynamical intensity of extratropical cyclones.”
For projections, AR6 is carefully hedged, stating with medium confidence that for future changes in overall ETC intensity, “in the future, these changes will be small,” but their location and tracks may also change, along with other nuances.
The AR6 also evaluates time-of-emergence for ETC wind extremes. Time of emergence is the point at which a change in a particular weather or climate variable over decades or longer becomes large enough relative to climate variability to be robustly detectable in observations.
For extratropical cyclone wind speeds, AR6 concludes that this threshold has not yet been crossed, and does not expect it to be crossed any time soon (the strongest claim the IPCC makes is with medium confidence, i.e., 50-50 or “as likely as not”) even under the most extreme and implausible climate scenario available for projections.
In plain language: even if ETCs are becoming more intense, the IPCC AR6 concludes the noise of natural variability will obscure that signal throughout this century. Logically, that means that the IPCC expects any such signal to be small in the context of variability, and not detectible in 2026.
To complete this discussion, I’ll review what would be needed for a robust detection claim:
- The detected signal must be distinguishable from internal variability. The satellite-era trend in ETC intensity is small relative to year-to-year variability, even over that 46-year period — Hence the low statistical significance.3 Large-scale climate modes operating on decadal timescales — such as the North Atlantic Oscillation, Atlantic Multidecadal Oscillation, and Pacific Decadal Oscillation — produce changes in extratropical storm activity that are distinct from long-term forcing. The 46-year satellite record is short compared to these modes, making it difficult to distinguish a forced trend from internal variability.
- Any detected signal must be robust across methods and datasets. Chen et al.’s supplementary material shows that the result is sensitive to start date (e.g., near-null from 1950, as shown above), to statistical method (e.g., the sensitivity analysis in the Chen et al. supplementary material indicates that Mann-Kendall significance concentrates in the 62nd–85th percentile, not the extreme tail), and to storm radius choice.4 The paper uses no independent reanalysis — JRA-55, MERRA-2, or the 20th Century Reanalysis — to assess the robustness of the findings, which are based solely on ERA5.
- For attribution claims, any detected signal must be consistent with model-based attribution. The paper offers a hypothesized physical mechanism for intensifying nor’easters (warming Atlantic sea surface temperatures feeding nor’easter intensification) but provides no model-based attribution analysis. The data presented and statistical analysis are not suggestive that any such attribution analysis is even appropriate. Attribution claims of Chen et al. are entirely speculative.
Taken together, these factors would, in my view, lead to a low confidence finding by IPCC standards. That is very different from “our study demonstrates that this [trend in intensity] can now be seen in the observations.”
From Research to Spin
Chen et al. does not discuss that the results are sensitive to start-date choice, that the satellite-era robustness check concentrates significance in the middle of the distribution rather than the extreme tail, or that the analysis leaves natural decadal variability and ERA5’s temporal inhomogeneities unaddressed.
Following publication, Mann presents the marginal (at best) findings as a demonstration of established fact, invokes a wind-speed-cubed adjustment to the small findings to generate impressive-sounding numbers related to real-world damage, and omits the contradictory evidence included in the paper’s supplementary material.
Other than that, how was the play Mrs. Lincoln?
The over-hyping of results and shedding of uncertainty and complexity is a pattern we often see in high-profile climate research, and chronicled in detail over the years here at THB. Loose standards of scientific quality may help to generate breathless headlines, but does not serve improved scientific understandings or public confidence in climate science.