The reactions to the DOE Climate Working Group (CWG) report released last week have been just as interesting as the report itself. The degree of vitriol and freak-out by activist climate scientists and journalists has surprised even me, who has seen it all.
For instance, one NASA climate scientist wrote on X of the authors of the report:
In any other community these people would have been shunned for scientific misconduct long ago. But it is indeed only in climate science that enough useful idiots exist and serious people have to pretend it’s reasonable . . .
He is not the only one to accuse the authors of the report of “scientific misconduct.” Others have suggested in the New York Times, Washington Post, and the Guardianthat there is nothing accurate in the report. The self-appointed science sheriffs are of the same small group who appear in the same media outlets trying to police discourse on climate — It is an incredibly sad statement about this field.
In reality, the DOE CWG report substantially overlaps with the most recent assessment of the IPCC — it cites the IPCC over 100 times. One would think that the nuanced, in most cases small differences, between the CWG and the IPCC provide an opportunity for the climate science community to acknowledge these views and in the process enlarge the tent and help to make climate science more robust and worthy of trust. Instead, we see an organzed smear campaign.
Here at THB, I will take a different approach and take the CWG report seriously. Specifically, today will be the first of a series of posts, in my areas of expertise, where I’ll examine some key claims of the report.
My views on the 2009 EPA greenhouse gas endangerment finding are clear and can be found here and here. Unlike the Trump administration, I think the finding should remain in place as a matter of both law and science (with the law being far more important). That said, the science of the endangerment finding is well out-of-date, and it should be updated to better inform regulation. I do not think the endangerment finding or any possible subsequent regulations can possibly have much effect on the pace of U.S. decarbonization — on that, I promise you a big surprise at the bottom of this post.
With that throat-clearing, let’s jump into the DOE CWG report.
Today, I take a close look at the following claims of the report:
- “Climate projections are based on IPCC emission scenarios that have tended to exceed observed trends.”
- “As of 2023, global CO2 emissions have been tracking well below SSP7.0 and are even below SSP2-4.5.”
I would give this section of the report (specifically section 3.2.1) a “B-” as a grade. The two claims above are accurate, but if anything, the report underplays its arguments here by focusing too much on the improbable RCP8.5 scenario — which did not exist at the time of the 2009 endangerment finding, and not fully explaining the profound significance of this section to climate science.
Changing views of emissions scenarios are arguably the most important evolution in all of climate science over the past 25 years. They should be at the forefront of efforts to update not just the 2009 endangerment finding, but ongoing climate research and policy analyses.
Today, I focus on projected radiative forcing,1 which in lay terms is a measure of the degree of change in the climate system resulting from the accumulation of greenhouse gases in the atmosphere (as well as other factors). A greater radiative forcing (measured in units of watts-per-meter-squared) means a greater change in climate, which is often expressed as a change in average global surface temperatures.
It has become commonplace to express climate scenarios in terms of projected 2100 radiative forcing. So RCP8.5 is a scenario with a radiative forcing of 8.5 watts-per-meter-squared in 2100. Similarly, SSP-7.0 and SSP2-4.5 have 2100 radiative forcings of 7.0 and 4.5 watts-per-meter-squared, respectively.
The authors of the 2009 EPA endangerment finding relied on two sets of scenarios in their projection of future changes in climate and the risks posed by those changes.
The figures below show these nine scenarios and their projected radiative forcings.
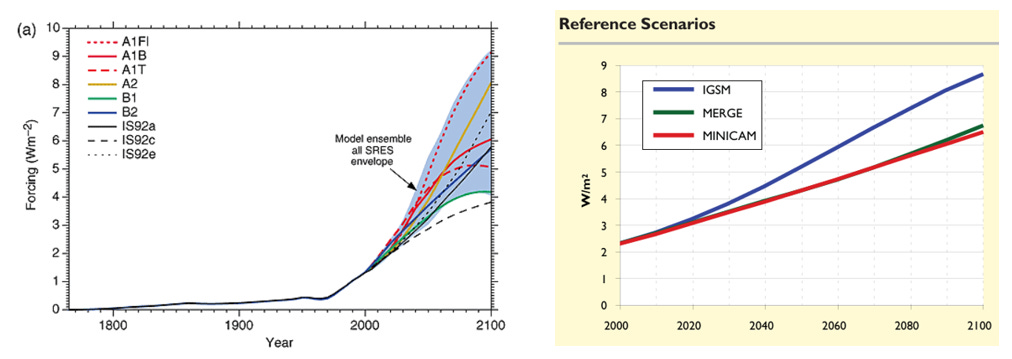
Below, I list the scenarios used in the 2009 endangerment finding, which I have renamed using their 2100 radiative forcings, as is common today, and ranked them from high to low radiative forcing.
- A1FI-9.2 (SRES)
- IGSM-8.6 (CCSP)
- A2-8.1 (SRES)
- MERGE-6.6 (CCSP)
- MiniCAM-6.4 (CCSP)
- A1B-6.1 (SRES)
- B2-5.7 (SRES)
- A1T-5.1 (SRES)
- B1-4.2 (SRES)
You can see that these nine scenarios are heavily skewed to very high levels of 2100 radiative forcing, with two even more extreme than RCP8.5. Eight of the nine project a central estimate of global average temperature increase to 2100 (above pre-industrial) of greater than 3 degrees Celsius — a value today viewed to be unlikely.
Don’t take that from me — take it from Zeke Hausfather, one of the loudest and angriest critics of the DOE CWG report:
The literature on current policy scenarios has become increasingly robust in recent years, with a growing consensus that the central estimate of 21st century warming is now likely below 3 °C.
The average radiative forcing across the nine scenarios is 6.7 watts-per-meter-squared. Only one of these scenarios — B1-4.2 — is consistent with what today are called “current policy” scenarios, and projects a 2100 temperature increase of 2.5C (above preindustrial).
The figure below helps to put these nine old scenarios into a current context (the figure comes from one of our recent papers). The red oval surrounds the scenarios catalogued by the IPCC AR5 that survive our 2022 paper’s criteria of plausibility. Since then the red oval has shifted down even further (stay tuned). If you zoom in and squint, you can see that the SSP 4.5 scenarios are in that oval. Our analysis found the SSP 3.4 scenarios to be most consistent with our tests of plausibility — representing a median 2100 temperature increase of 2.2C over preindustrial values.
The dashed box in the figure shows the more extreme scenarios, ranging from SSP4-6.0 to SSP5-8.5. These scenarios are increasingly implausible, and many are now simply impossible.
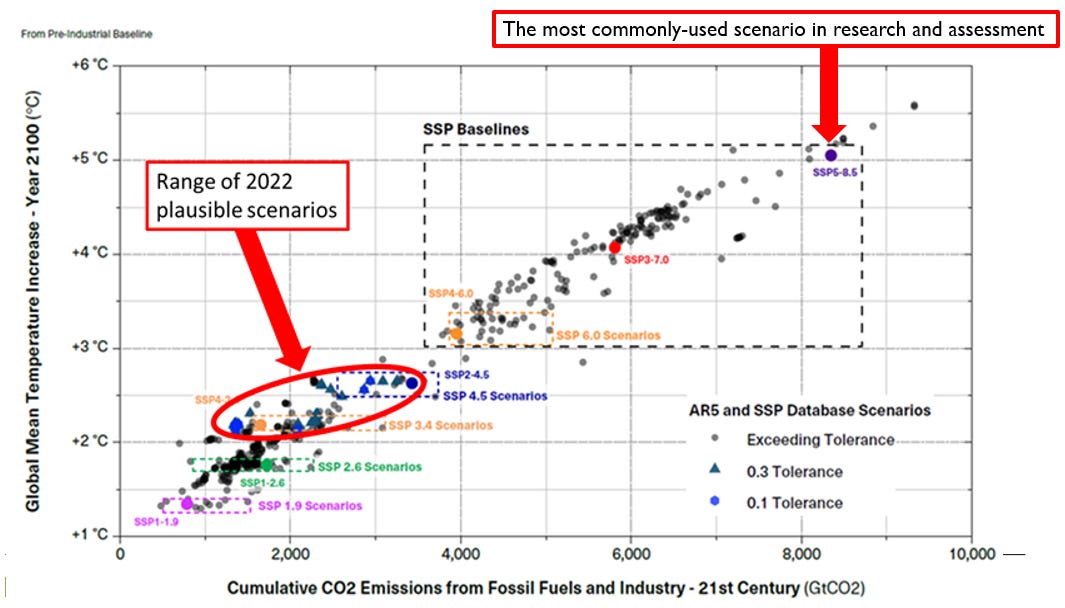
Of the nine scenarios used in the 2009 EPA endangerment finding all — except one — fall into the dashed box, with the average value right in the middle. The one exception, B1-4.2, falls into the red oval.
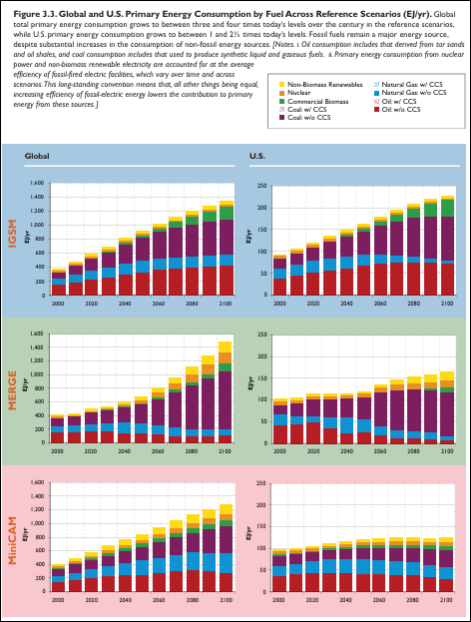
The 2009 EPA endangerment finding used scenarios that today are viewed to be too extreme. The main reason why the community’s view of future emissions has changed to less extreme scenarios is the recognition that future energy consumption will not be dominated by coal. For example, in the image below, from the 2007 CCSP scenario report, shows that each of the three scenarios project that coal will be the primary source of energy in the U.S. and the world. No one believes that anymore.
Lower projected future emissions means smaller projected changes in climate. Smaller projected changes in climate mean less projected risks and lower levels of projected impact. It also means that the challenge of reducing emissions — while still huge — is smaller than in futures with much higher emissions.
Moderating emissions scenarios is very good news. For some strange reason, critics of the DOE CWG report are in denial of this fact in their rush to demonize the report’s authors. Some have even taken to defending RCP8.5. Amazing.
Based on the changing perspectives of emissions scenarios, in 2025 projected climate change to 2100 necessarily must be less extreme than that of the 2009 EPA endangerment finding. This should be uncontroversial.
One last point for today — I was curious about the stakes involved with potential regulation that might follow from the EPA endangerment finding. These stakes must be huge, given the massive freak out associated with the proposal to rescind the finding? Guess again.
Let’s look at some numbers. According to the Center for Climate and Energy Solutions, the projected carbon dioxide emissions reductions of the EPA 2021 light vehicle greenhouse gas emissions standards were estimated to be 3.1 billion tons, cumulatively to 2050.
From 2025 to 2050, the world would emit >900 gigatons of carbon dioxide, assuming constant 2025 emissions, and ~700 gigatons assuming emissions are cut in half by 2050.3 That means that the 2021 EPA regulations would reduce global emissions by ~0.3% (assuming constant emissions) or ~0.4% (assuming emissions are halved). I posted these numbers on X, expecting some pushback, I received none. I welcome alternative views in the comments.
I was surprised at how miniscule these numbers are, given the importance that some have placed on EPA’s ability to regulate greenhouse emissions.4 My view is that it is practically and politically impossible to accelerate decarbonization through these types of regulations. If the aim of such regulations is to create a shadow price on carbon, there are much more efficient and effective ways to price carbon.
The DOE CWG report and the response to it might tell us more about the state of climate science than it does about what might comprise effective climate policy.
1 According to the IPCC AR6: Radiative forcing is: “The change in the net, downward minus upward, radiative flux (expressed in W m–2) due to a change in an external driver of climate change, such as a change in the concentration of carbon dioxide (CO2), the concentration of volcanic aerosols or in the output of the Sun.
2 The CCSP was the Climate Change Science Program of the Bush administration, which broke up the U.S. National Climate Assessment into more than 20 different working groups.
3 It is ~450 gigatons assuming emissions are cut to zero in 2050. This thought experiment doesn’t depend on these assumptions.
4 The logic must be that regulations would expand across the economy to include every source of greenhouse gases and that the regulations would steadily tighten over time, eventually squeezing all GHGs from the economy.