The International Energy Agency has just published its Global Energy Review 2025. In this post I share the five most important take-aways I see in the report. I encourage you to have a look at the full report for IEA’s interpretation of its top conclusions.
Let’s jump right in . . .
- Carbon Intensity of GDP
Have a look at the figure below — I want to draw your attention to the blue (lowest) line in the right hand panel, which shows the 2015-2024 decrease in the carbon dioxide intensity of global GDP, which goes by the technical term, decarbonization of the economy.
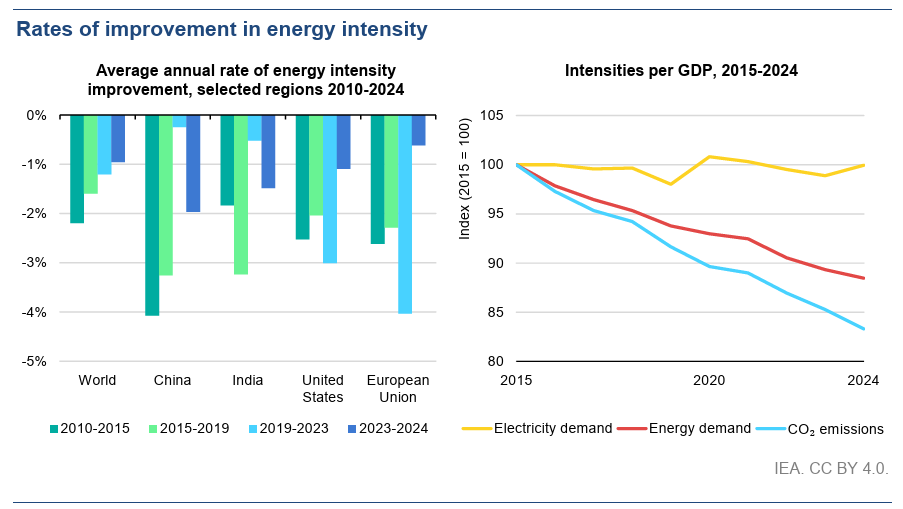
The rate of decarbonization over the period 2015 to 2024 is ~1.9% per year. THB readers heard about this first last August in a post where I compared decarbonization rates for countries around the world for 8 years prior to the Paris Climate Agreement to the 8 years following the Agreement.
As I concluded then, and as the IEA data indicates (note that the IEA does not discuss these implications) — there is no indication of any acceleration in the overall rate of global decarbonization since 2015, and in fact, since 1965.
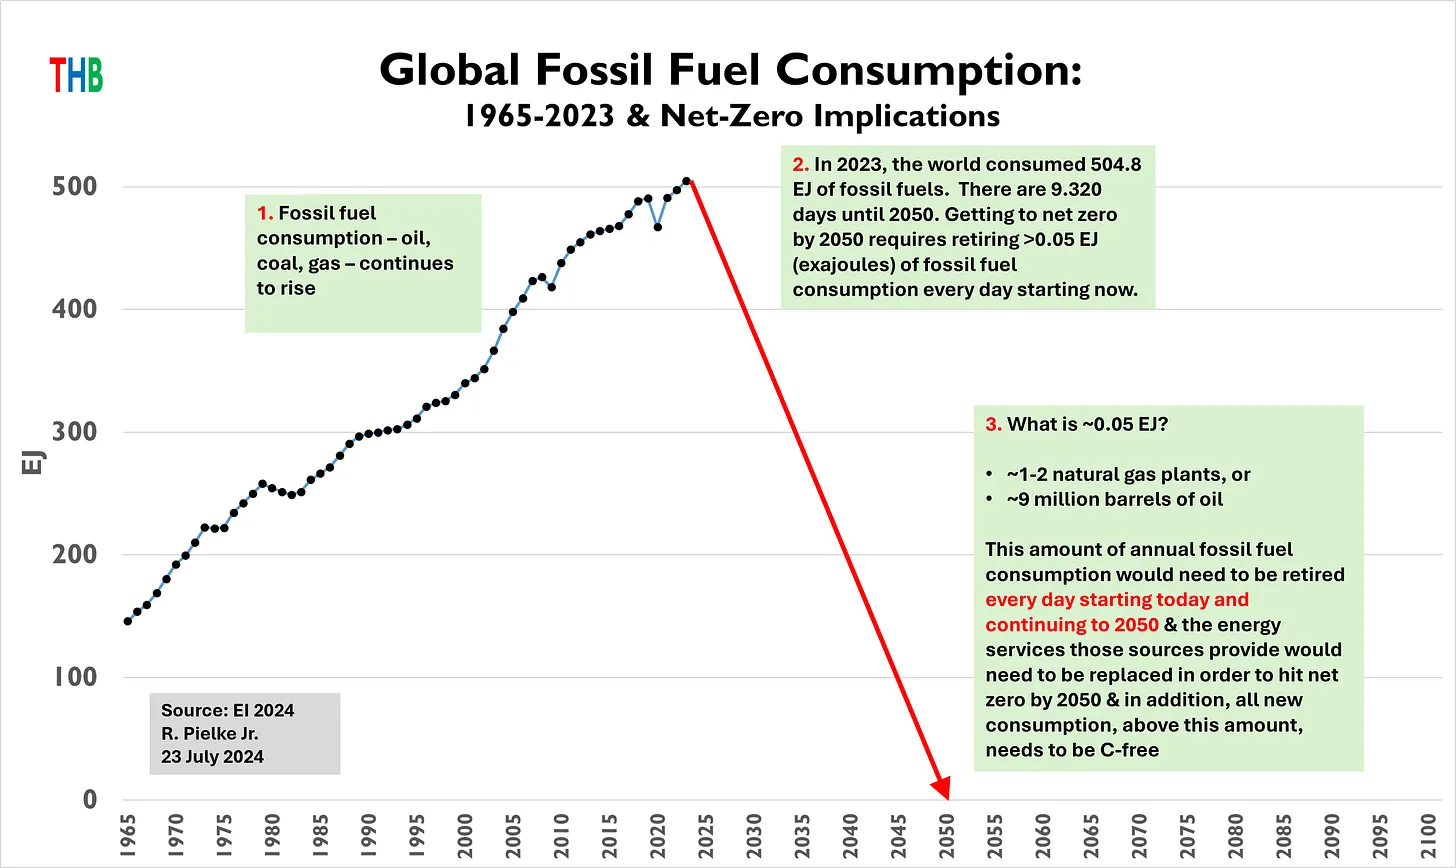
Consider that to achieve an 80% reduction in global greenhouse gas emissions by 2050 implies a rate of decarbonization of 8.1% per year (for a 2.5% annual rate of GDP growth), far larger than the 1.9% since 2015 presented by the IEA.
The IEA explains:
The carbon intensity of global economic activity is the product of two factors: the energy intensity of GDP and the carbon intensity of total energy supply. As noted above, the energy intensity of GDP improved by around 1% in 2024. The carbon intensity of total energy supply improved by 1.1% in 2024. Combining these factors gives an improvement in the CO2 intensity per unit of economic activity of 2.1% in 2024. This is slightly slower than the average improvement seen over the last decade and was caused by the slowdown in the improvement in energy intensity.
Global climate policies have many consequences, but accelerating the rate of decarbonization is thus far not among them.
- Growing Global Energy Demand
The figure below shows how overall energy demand increased from 2023 to 2024, by region and energy sources that met that demand.
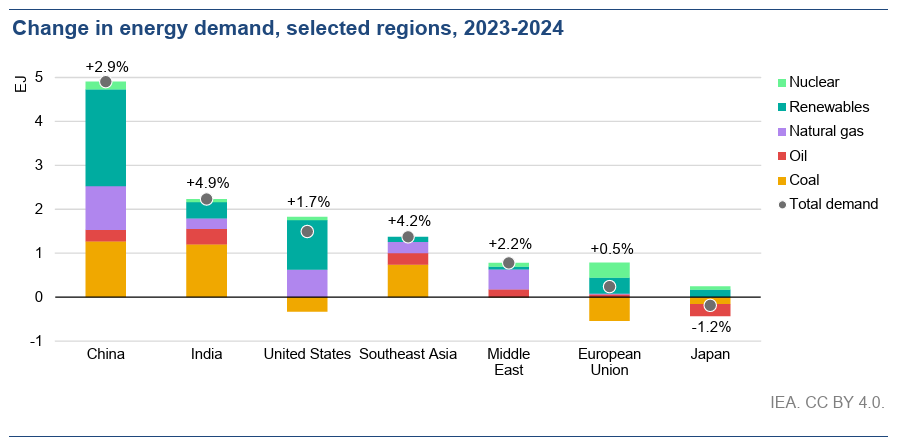
A few key elements of this figure:
- China and India dominate increasing energy demand, but demand increased everywhere except Japan;
- The US, EU, and Japan saw decreasing demand for coal, everywhere else saw an increase, notably China and India;
- Renewables1 met large parts of demand increase in the U.S. and China.
The IEA explains:
Across the energy system, all fuels and technologies saw growth in 2024, although at different speeds. Among fossil fuels, natural gas grew the fastest, with demand rising by 2.7% to reach a new all-time high in 2024. Higher demand was focused in fast growing Asian markets, with growth of over 7% in China, and over 10% in the smaller Indian market. Advanced economies saw a return to growth in 2024 after two years of declines linked to higher prices. Globally, demand growth was driven by higher industrial use, and by increased gas use in power generation (in part due to the impact of extreme weather).
3. Rapidly Growing Demand for Electricity
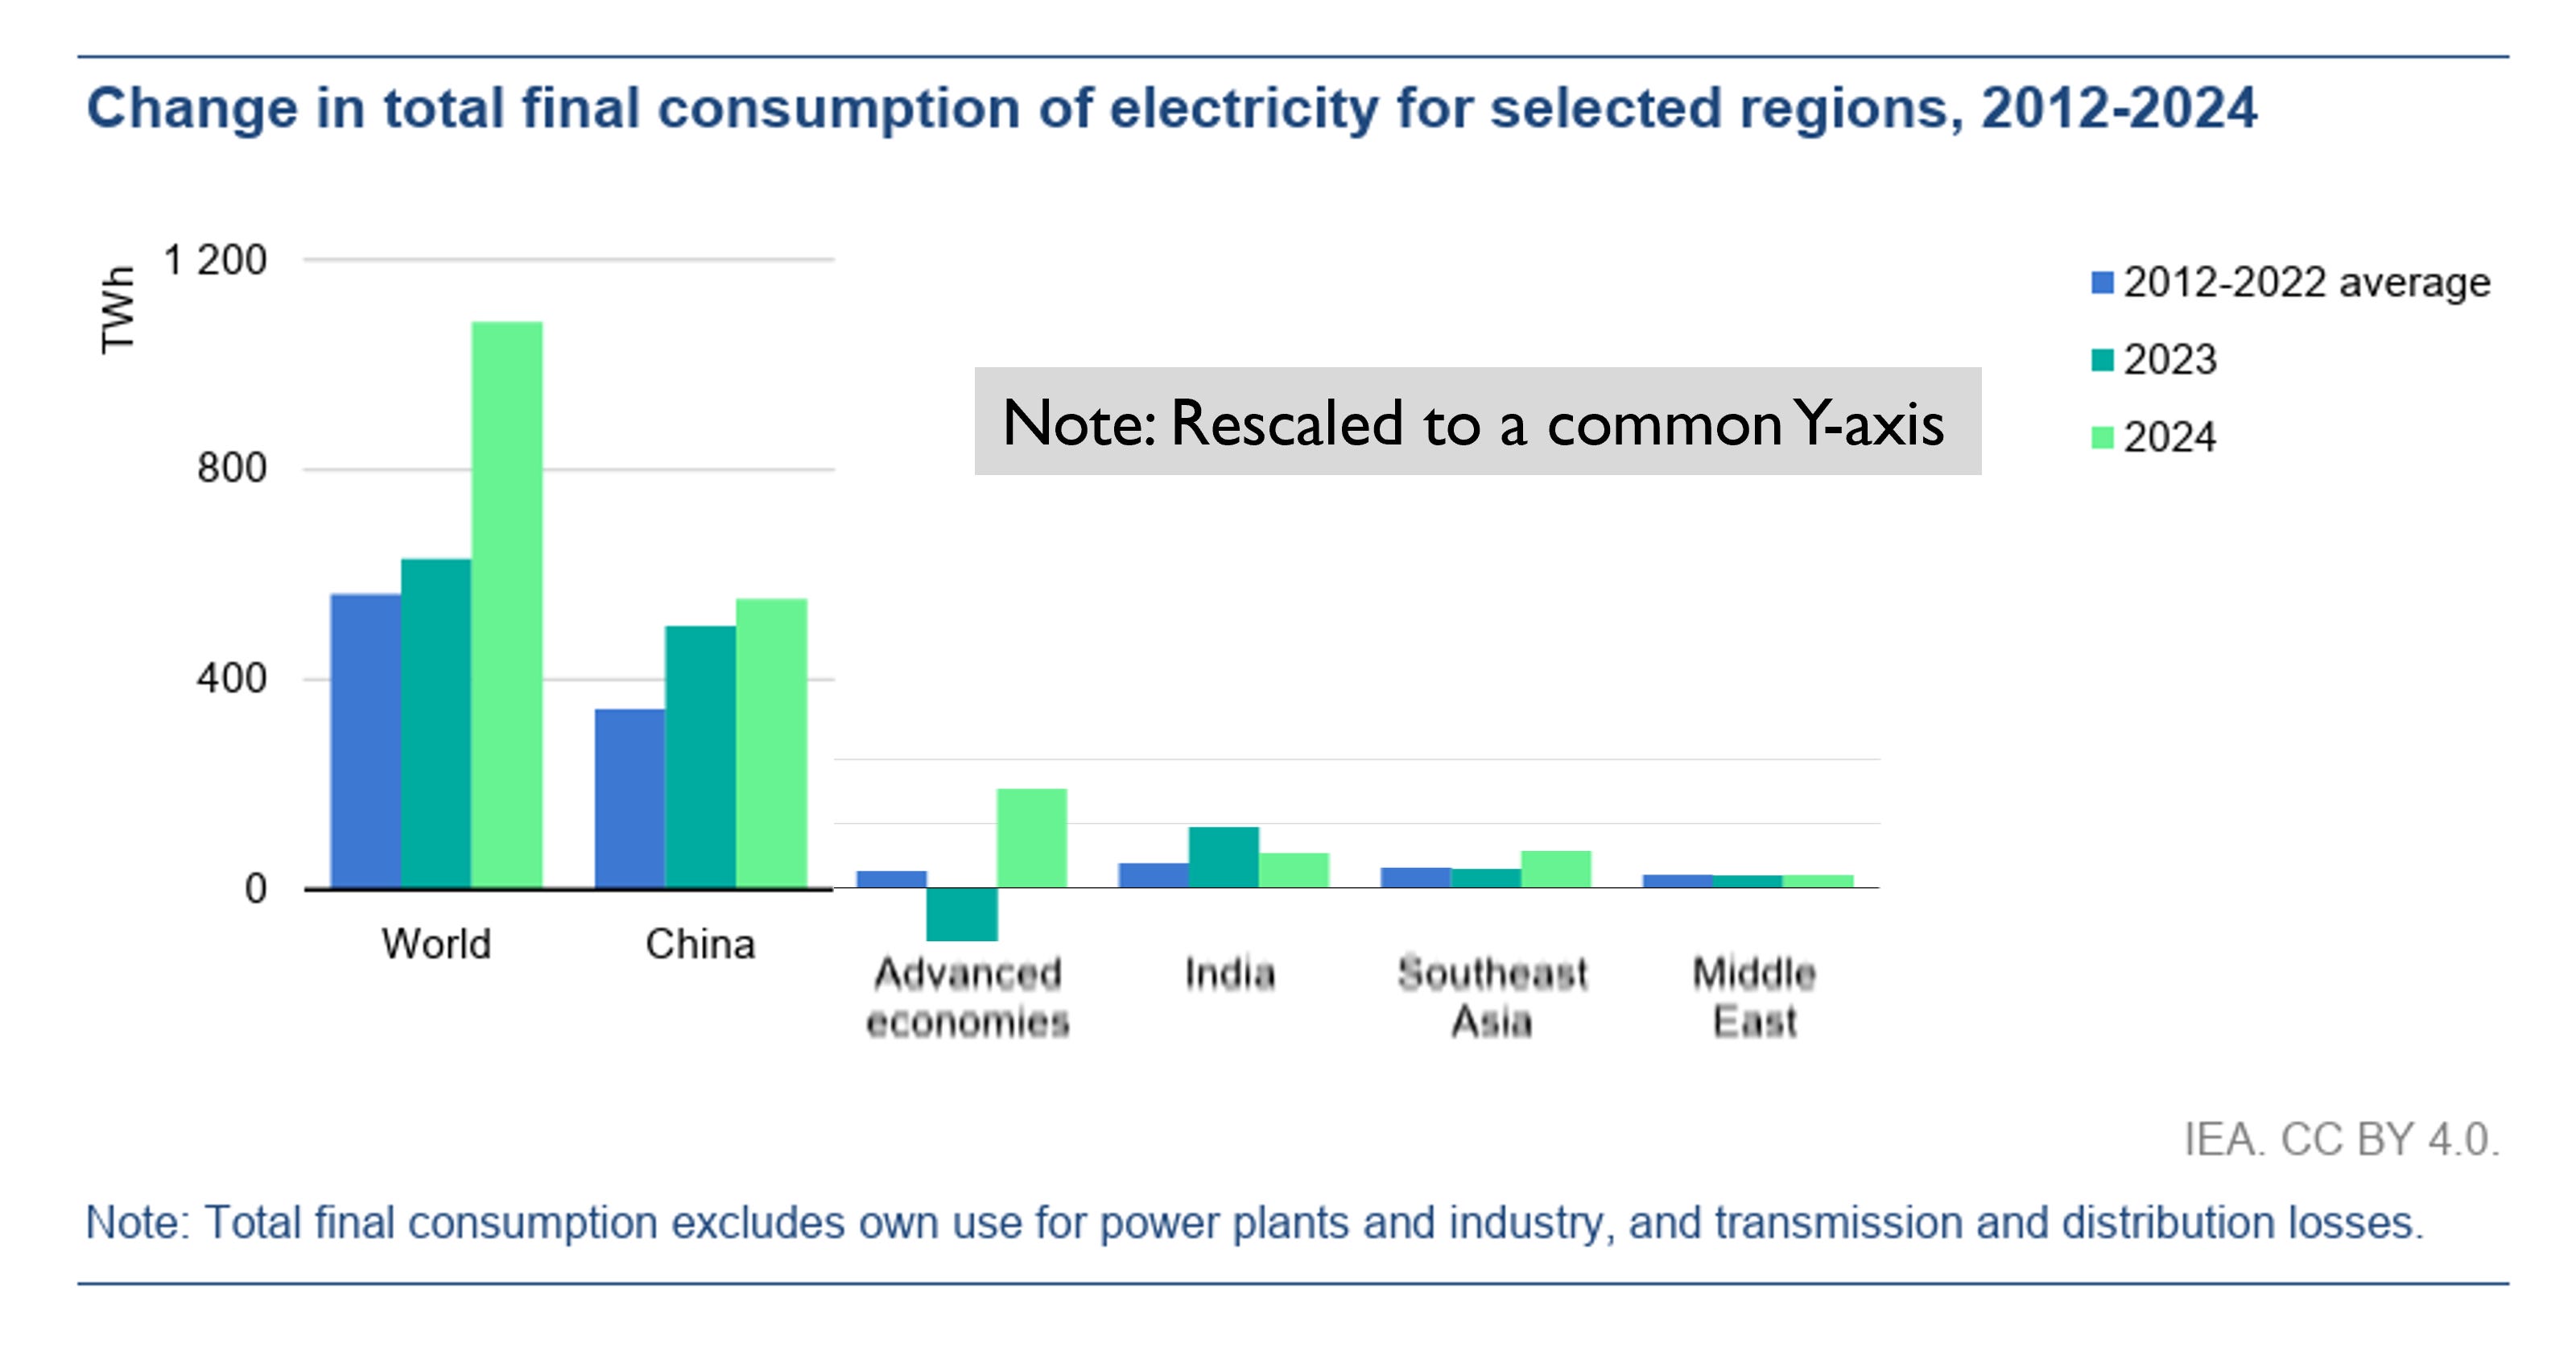
The figure below shows rapidly increasing global demand for electricity, driven by China’s massive appetite for energy. Note that I rescaled the figure to place all regions on a common scale, which makes interpretation of the data much more intuitive (see the IEA report for the original figure).
The IEA explains:
Almost all regions saw an acceleration in the rate of electricity consumption growth in 2024 compared with the annual average from 2012 to 2022. Globally, electricity consumption increased by 1 080 TWh, nearly two times the annual average of the past decade.
How much electricity is 1,080 TWh (terawatt-hours) in more understandable units?
According to the World Nuclear Association, one nuclear power plant (a “1000 MWe unit”):
. . . provides over 8 billion kilowatt hours (8 TWh) of electricity in one year.
So that means that 1,080 TWh is the equivalent of bringing online 135 new nuclear reactors in 2024. In another recent report on global electricity the IEA expects electricity demand to accelerate:
Over the next three years, global electricity consumption is forecast to rise by an unprecedented 3,500 TWh. This corresponds to adding more than the equivalent of a Japan to the world’s electricity consumption each year.
Let’s do some simple math — Assume that the world will continue to need the equivalent of ~125 new nuclear power plants every year equivalent new electricity (3,500 TWh is about 435 nuclear power plants worth of annual electricity demand). Let’s also assume that the world wishes to reach net-zero carbon dioxide. In round numbers the world currently gets ~60% of its ~25,000 TWh of annual electricity consumption from fossil fuels. That means that ~2,000 nuclear power plants worth of electricty demand from fossil fuels need to be replaced (or mitigated).
There are 25 years to 2050. That implies the equivalent new nuclear of 125 per year * 25 years + ~2,000 to replace fossil fuel electricity = >5,000 new nuclear power plants equivalent. This simple math does not consider the push to “electrify everything” — Taking the IEA Net Zero scenrios assumptions would imply as much as a doubling of global electricity demand. Electricity is of course only part of overall energy consumption.
THB readers have seen this daunting math before:
- Electric Cars are Here to Stay
The figure below — which I have also rescaled to a common vertical axis — shows electric car sales around the world. China’s dominance is difficult to miss.
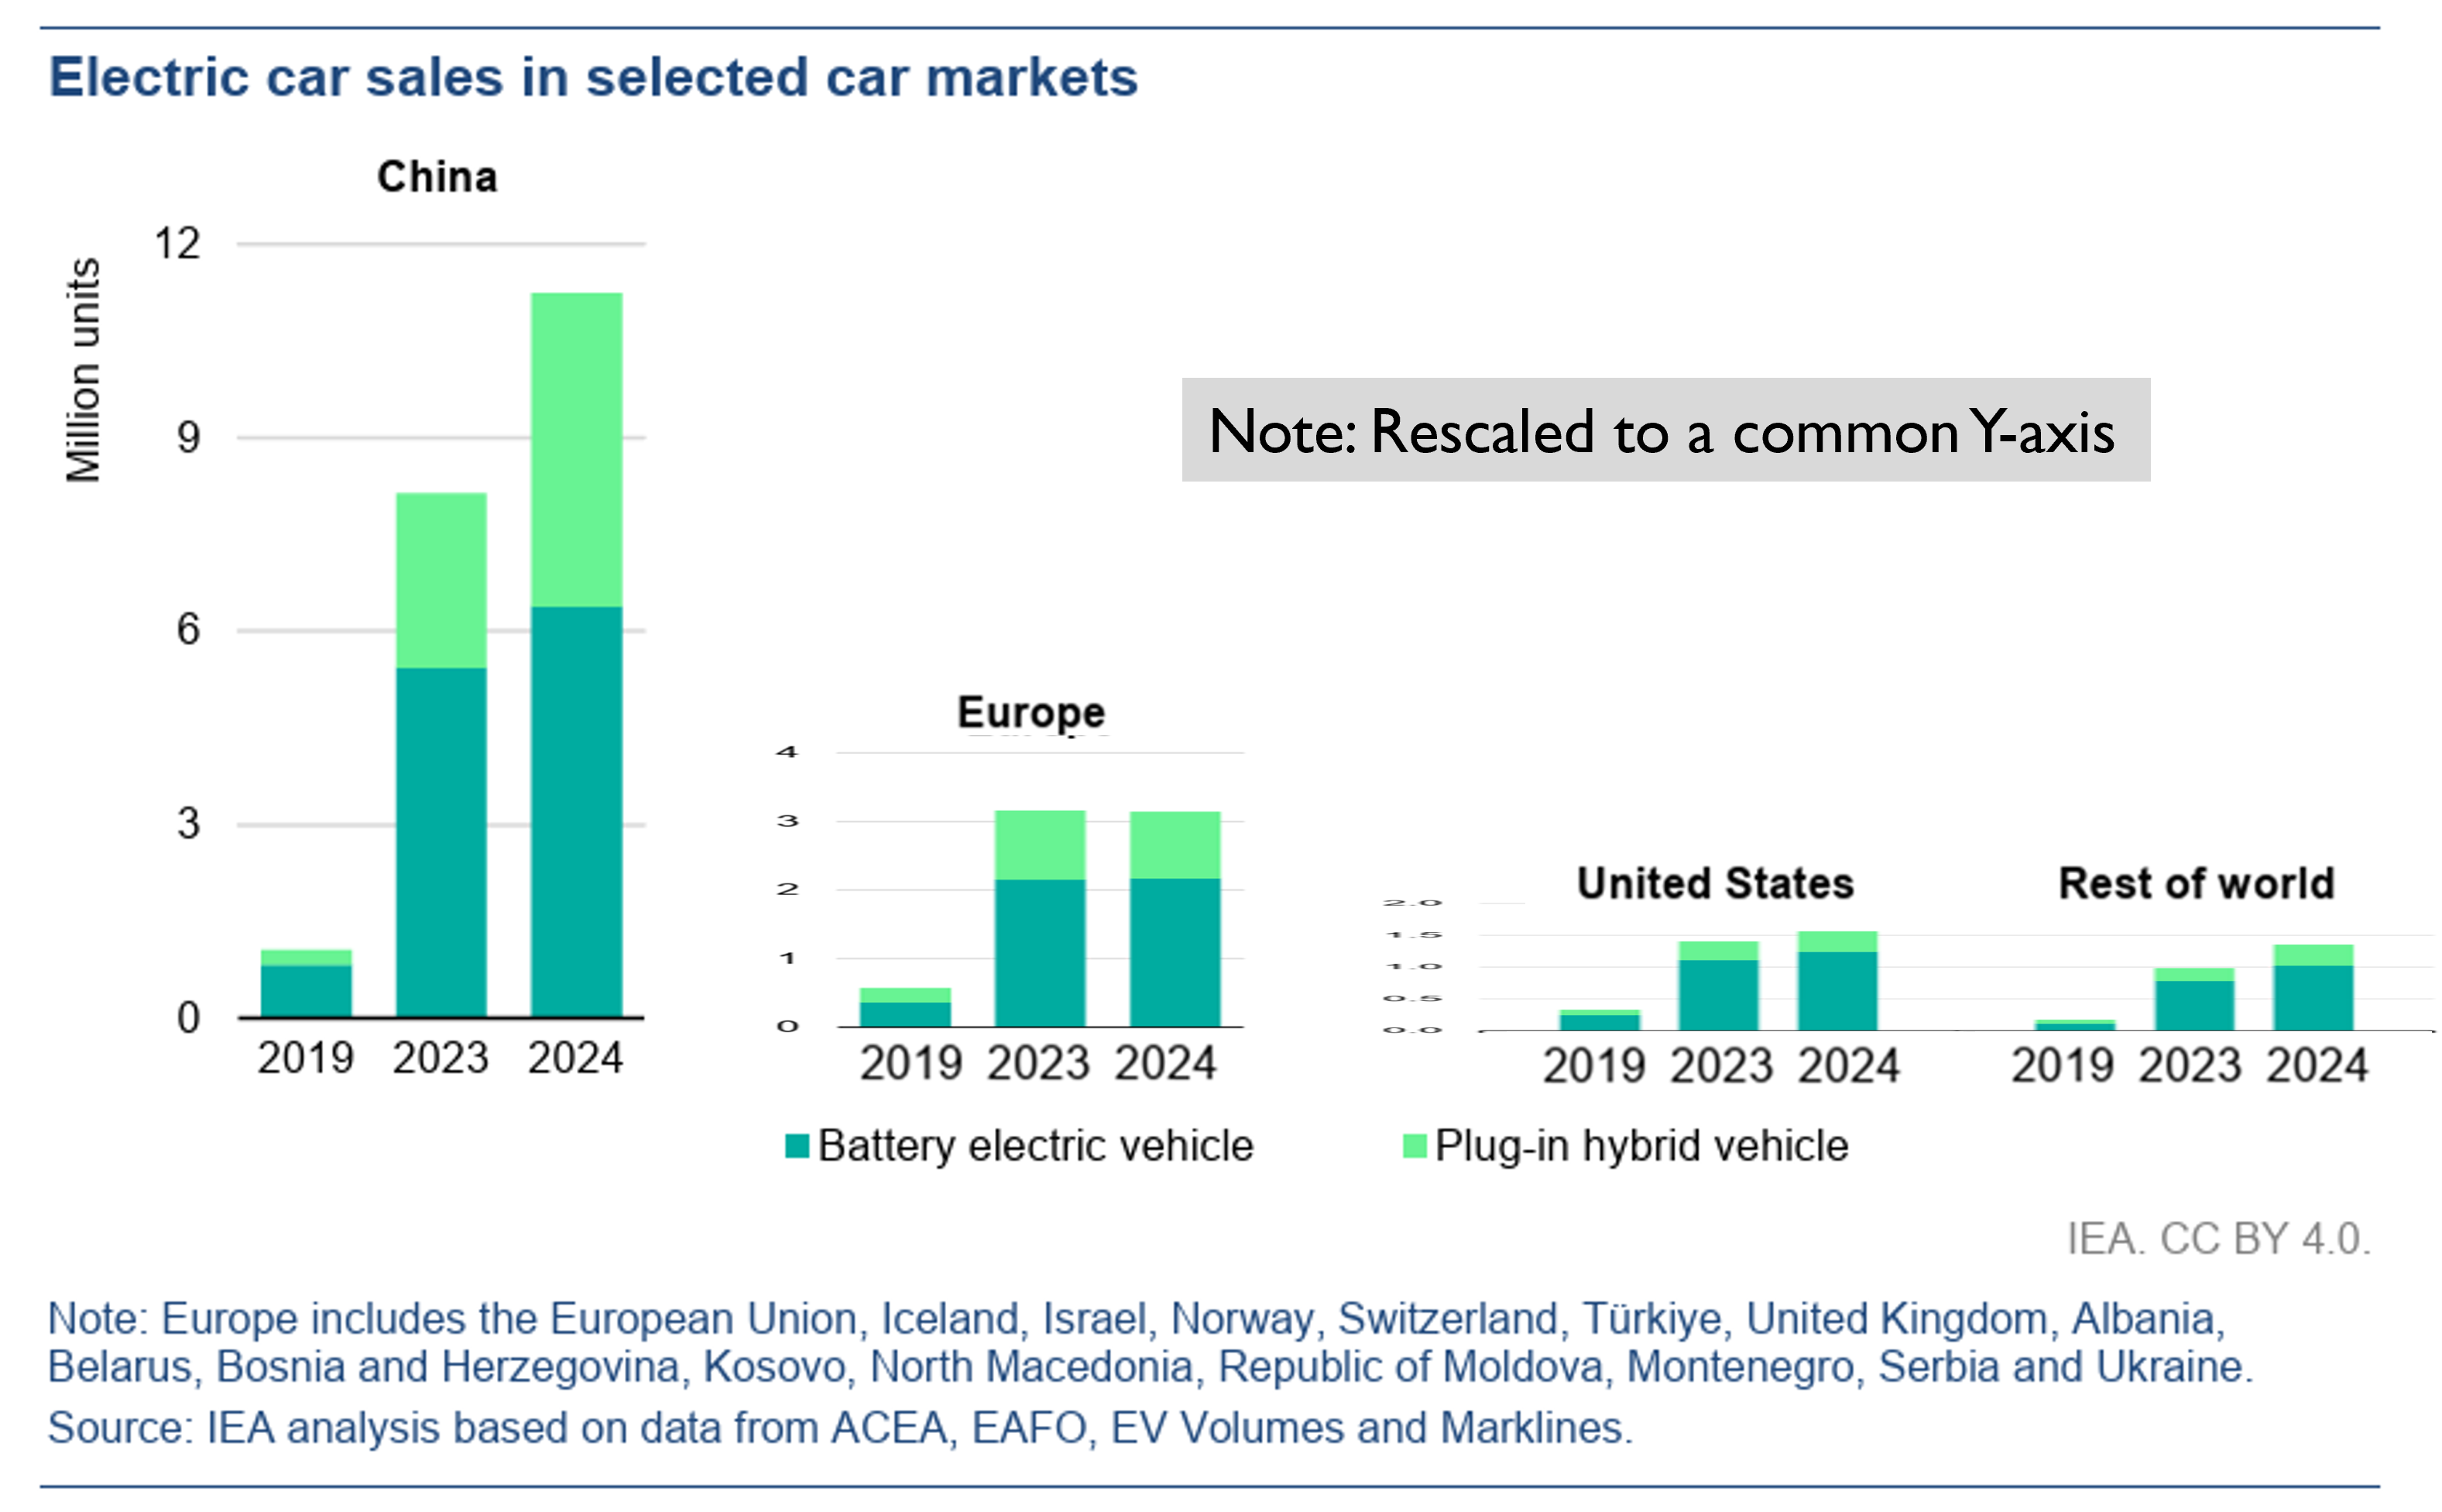
The IEA explains:
China was the leading driver of growth, accounting for almost two-thirds of global electric car sales in 2024. The country’s electric vehicle sales experienced an impressive annual growth rate of nearly 40%. A large share of this growth came from plug-in hybrid electric vehicles (PHEVs), where sales saw an 80% increase, compared with a nearly 20% rise in battery electric vehicles (BEVs). Growing demand for extended-range electric vehicles (EREVs) has supported this trend; the configuration is currently most prevalent in China.
Regardless what happens in the U.S. market, EVs are here to stay, and like their liquid-fuel counterparts, we should expect continuing technological innovation and improvements such that EVs take over the world. They are already on their way.
- Nuclear Power has a Bright Future, Driven by China and Russia
Similarly, nuclear power has a bright future, with a notable increase in new starts over the past four years. China and Russia dominate the global nuclear market. The U.S. is totally AWOL.
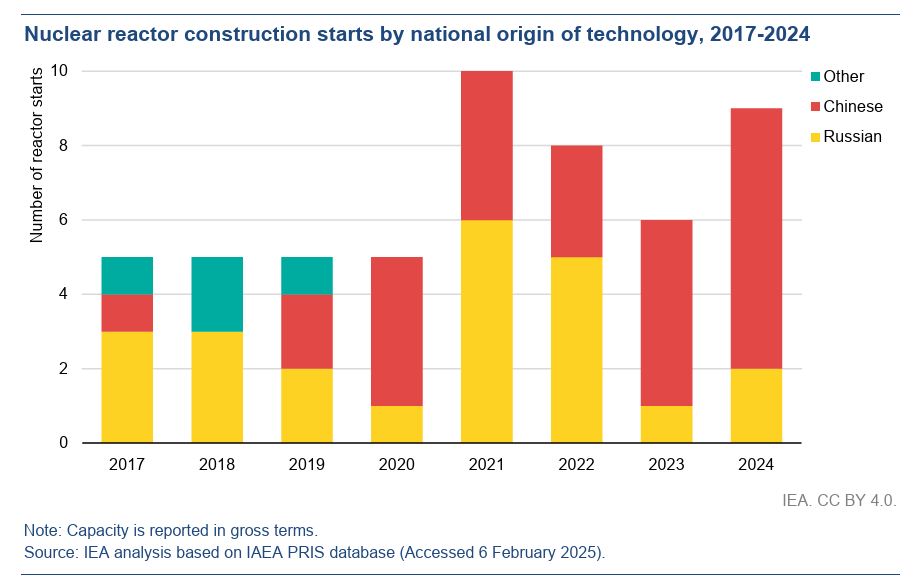
The figure above shows that, “over the past five years, all nuclear construction starts have used either Chinese or Russian designs.”
The IEA explains:
Globally, there were nine construction starts of nuclear reactors in 2024, 50% more than in 2023. When completed, they are expected to have a total capacity of 11 GW. China began construction of six nuclear reactors in 2024 (all of Chinese design) – one of the highest number of starts in the country ever and extending its market leadership in terms of construction. Pakistan began construction of one reactor in 2024, the first Generation III+ design of Chinese origin used outside of China. Egypt and Russia each began constructing one nuclear reactor in 2024, both of Russian design. . .
As of February 2025, there were a total of 62 nuclear reactors under construction in 15 countries around the world with a total capacity of nearly 70 GW. China accounted for nearly half of all nuclear capacity under construction in the world. Egypt, India and Turkey each have about 5 GW under construction. Across advanced economies, a total of 9.5 GW is under construction, including two reactors in Japan, two in Korea, two in the United Kingdom and one in Slovakia.
The U.S. risks falling not just behind, but out of the picture forever. Let’s see what the current administration and Congress might do to address this issue.
This article originally appeared on Roger’s Substack, The Honest Broker. If you enjoyed this piece, please consider subscribing here.
1 I do not like the term “renewables” — The IEA does not define the term but apparently it refers to wind and solar combined. I’d prefer these energy sources be broken out and be called “wind” and “solar.”
