Last Tuesday, at the 2026 Nuclear Energy Summit in Paris, European Commission President Ursula von der Leyen announced:
She was referring to nuclear power, noting that in 1990 one-third of Europe’s electricity came from nuclear and today it is roughly 15 percent: “This reduction in the share of nuclear was a choice.”1
That choice leads to a question: What might have happened had that choice been made differently? Specifically, what might the EU’s energy mix have looked like today if the bloc had instead committed to a nuclear powered future?
Today, I take a quantitative look at this question. I present two counterfactual histories from the early 2000s, at the peak of EU-27 nuclear consumption. In the first counterfactual I assume that instead of reducing its nuclear fleet, Europe chose to adopt a trajectory of modest growth. The second counterfactual assumes that Europe returned to the rate of nuclear buildout (mostly in France) from ~1970 to ~1990, bringing online about 7 new reactors each year.
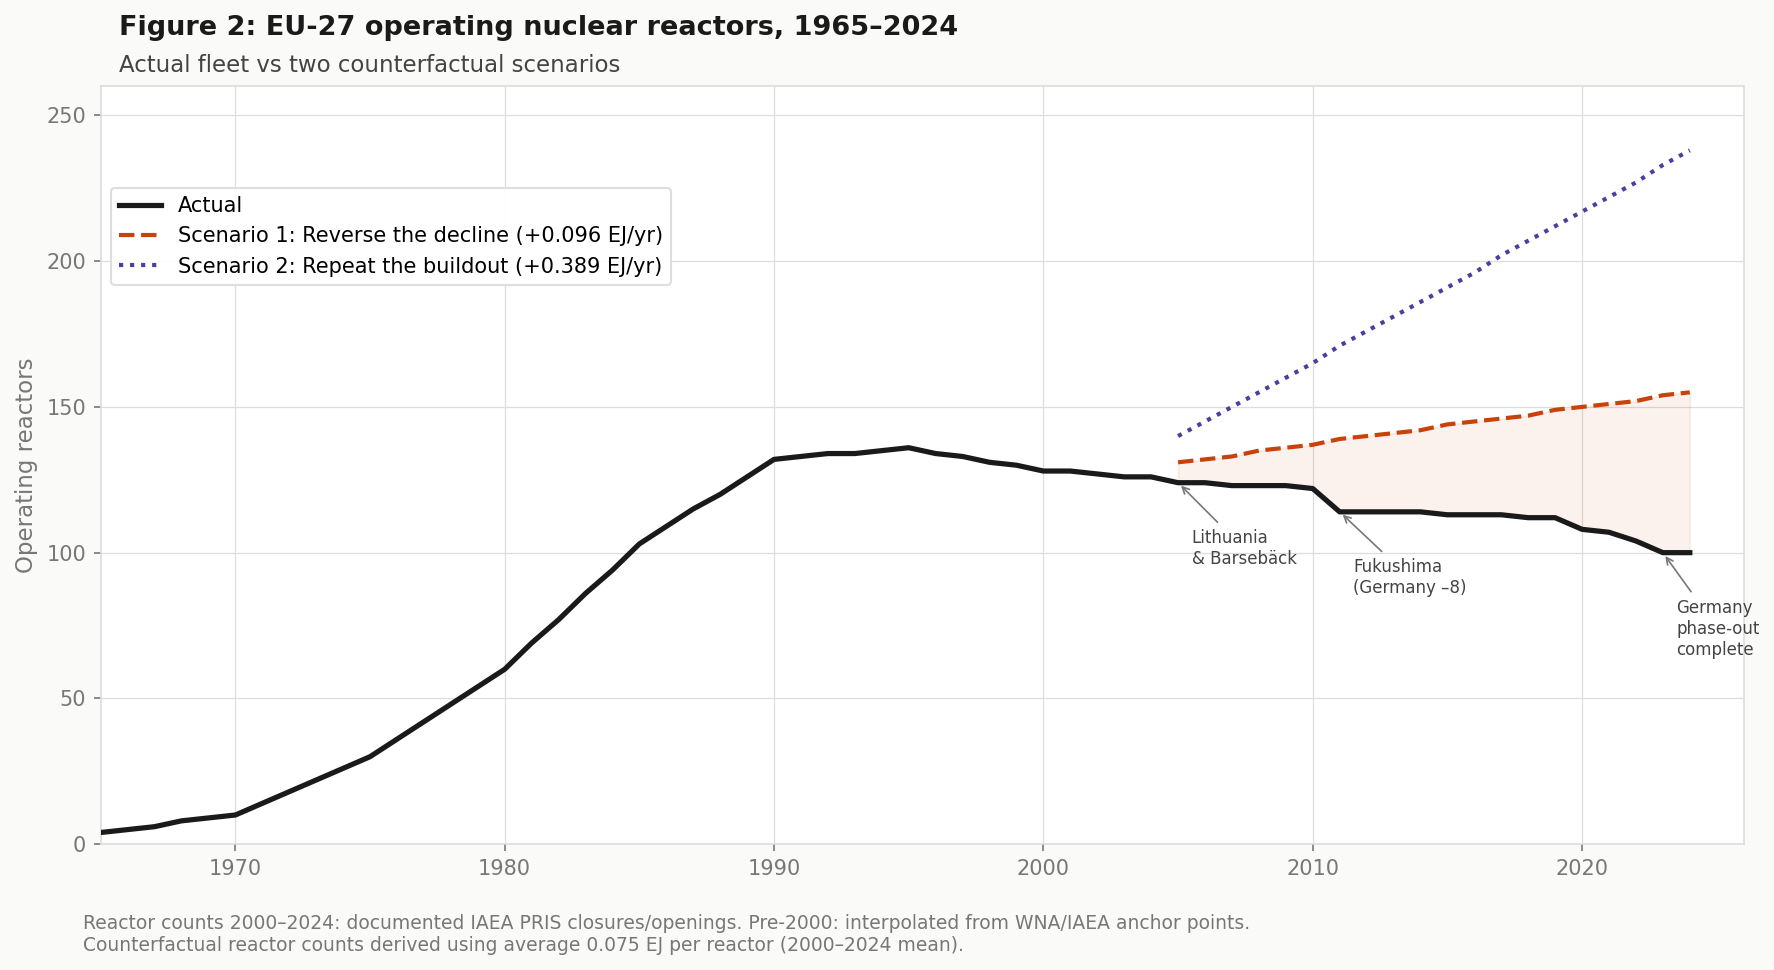
The EU-27 nuclear fleet began in the 1960s. By the mid-1990s there were 136 reactors across more than 50 different power plants driven overwhelmingly by France’s state-directed construction program. Between 1975 and 1990, 52 new reactors were connected to the French grid, one of the most successful nuclear scale-ups in history.
Then tailwinds became headwinds.
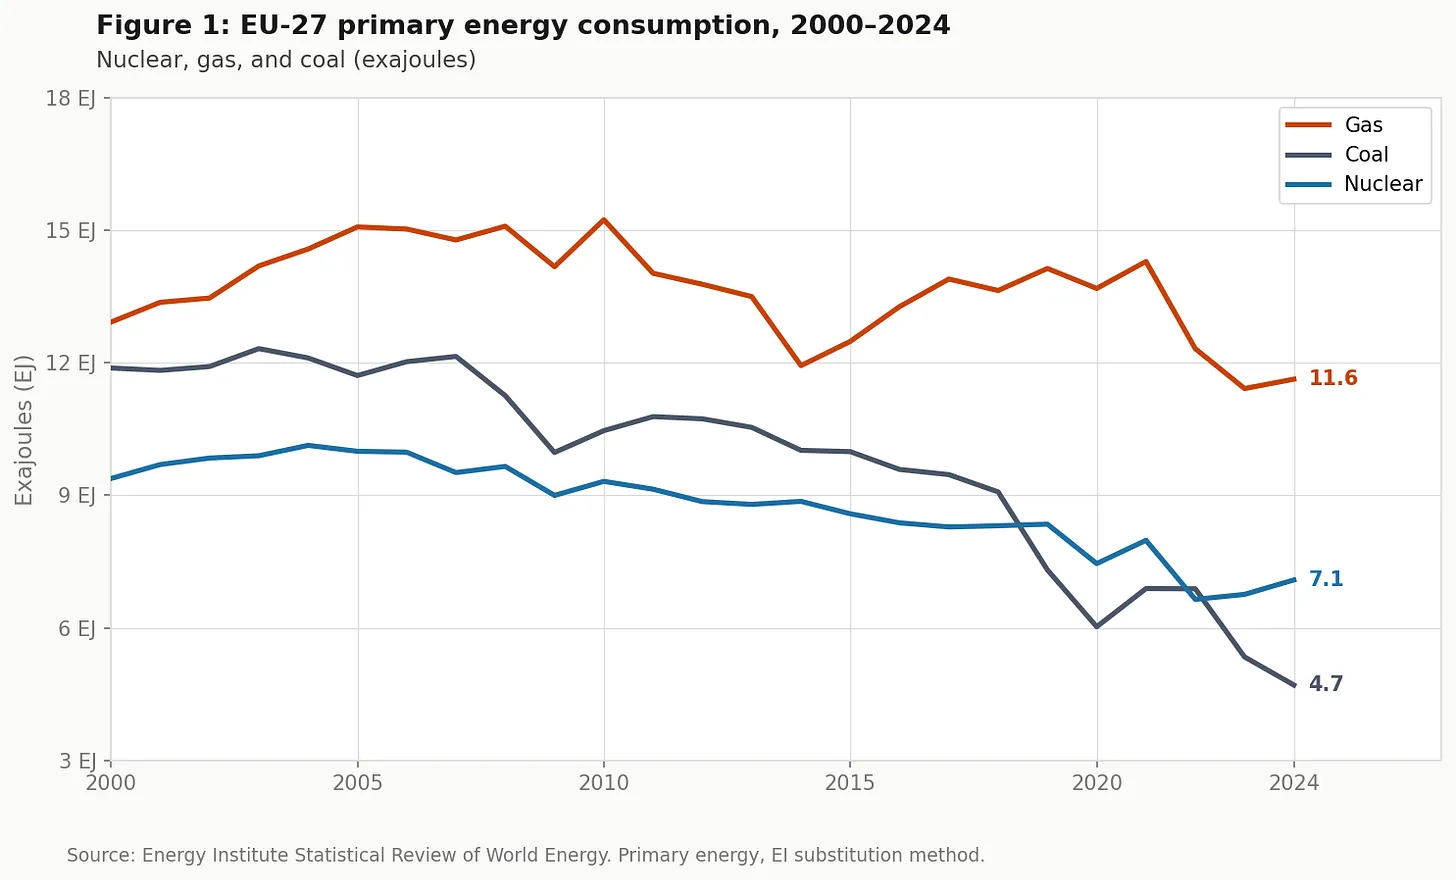
Bulgaria and Lithuania closed plants as conditions of EU accession. Germany shut eight reactors immediately after Fukushima in March 2011 and closed its last operating reactor in April 2023. Sweden shuttered four of its 12 commercial reactors. France began to walk back its commitment to nuclear power. By 2024 the EU-27 fleet stood at 100 reactors. Nuclear energy had fallen from a peak consumption of 10.1 exajoules (EJ) in 2004 to 7.1 EJ.
Meanwhile, gas consumption remained high and coal — though declining — was still just under 5 EJ as of 2024. The figure below shows the EU-27 consumption trajectory of all three for this century.
To explore how Europe’s energy trajectory might have played out differently, I explore two scenarios.
Scenario 1 — Reverse the decline. The EU-27 nuclear energy consumption declined at 0.096 EJ per year from 2000 to 2024. What if it had instead grown at that same rate? Starting from 9.4 EJ in 2000 and adding 0.096 EJ per year, nuclear energy would have reached 11.7 EJ by 2024 — roughly 155 operating reactors. This scenario results in an increase in nuclear energy consumption across the EU-27 of 4.6 EJ as compared to what actually happened.
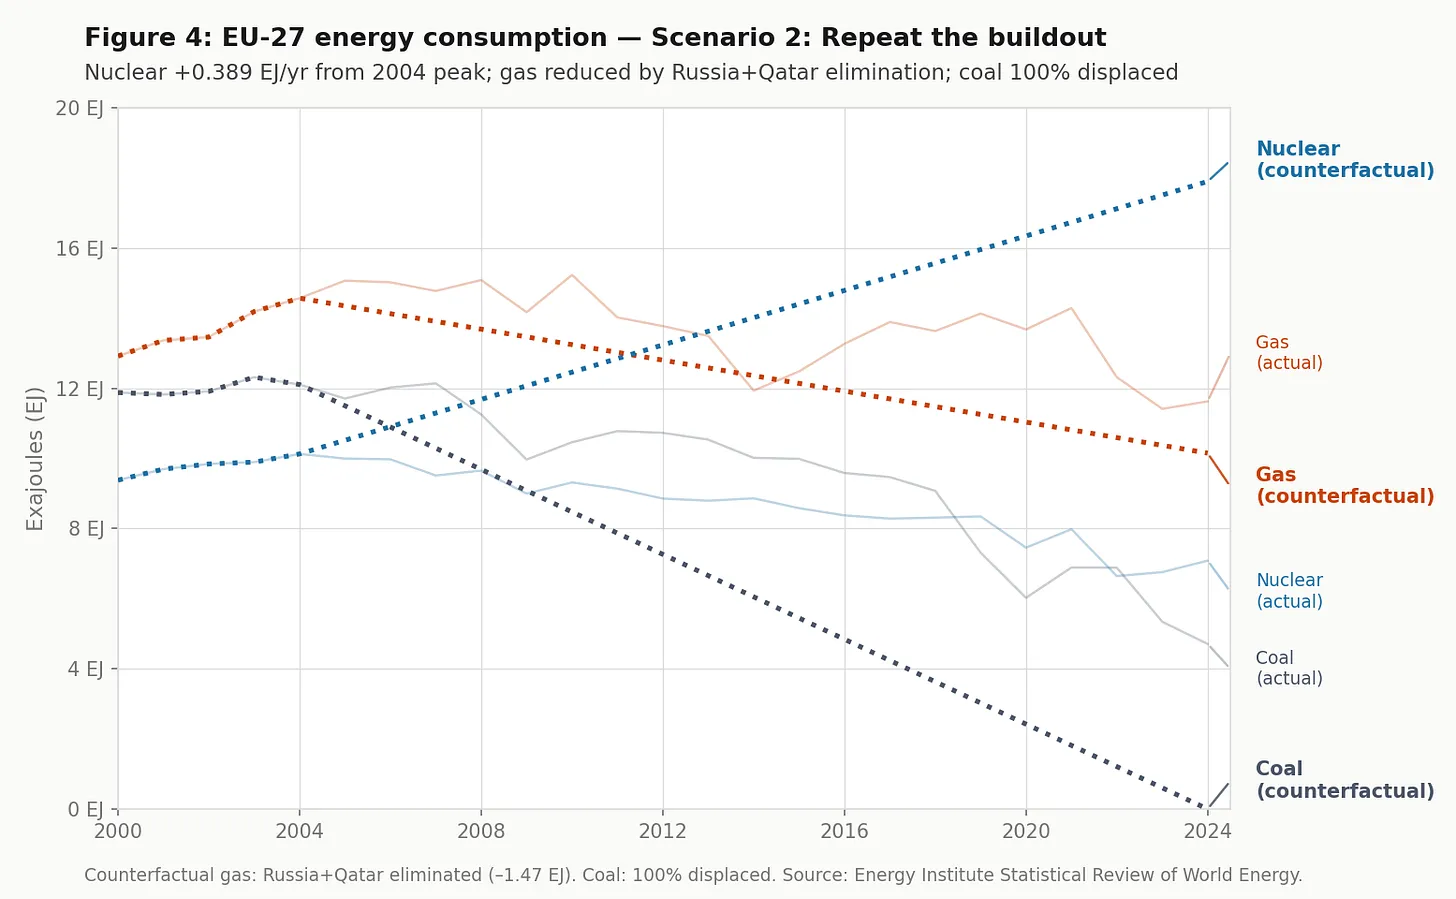
Scenario 2 — Repeat the buildout. Between 1970 and 1990, EU nuclear consumption grew from 0.18 EJ to 7.95 EJ — an increase of 0.39 EJ per years. What if that same rate of increase had continued from the 2004 peak? By 2024 the EU would have had roughly 238 reactors producing 17.9 EJ. That would have resulted in an increase of 10.8 EJ versus what actually happened — about a doubling in nuclear energy consumption from its 2004 peak. This scenario would have required a political commitment akin to that of France in the 1970s, with roughly seven new reactors coming online per year.
The figure below shows the full history of the EU-27 reactor fleet alongside both counterfactual trajectories.
The next question to ask is what the counterfactual nuclear generation could have replaced.
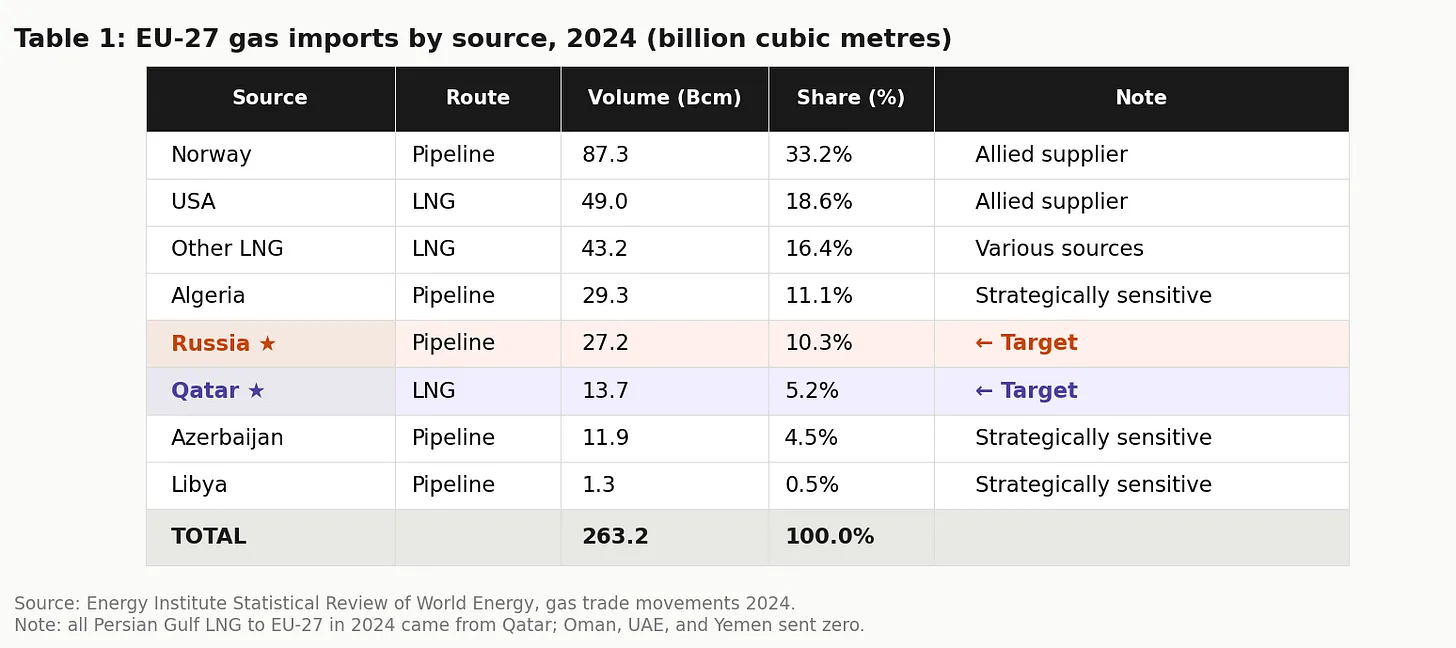
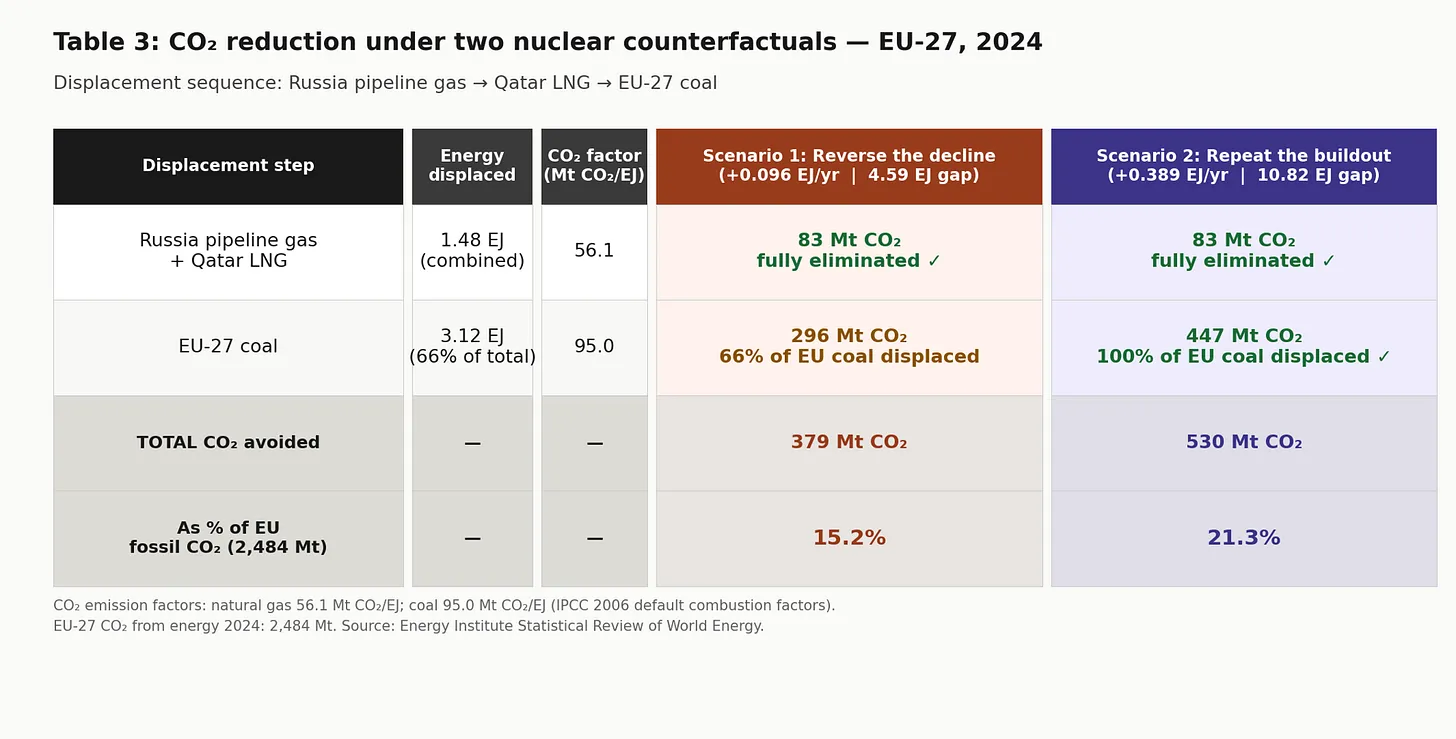
I assign the additional nuclear output of the counterfactuals to: (1) Russian pipeline gas, (2) Qatari LNG, and (3) EU coal. The table below shows where EU gas imports came from in 2024. My analysis simply considers 2024 as a snapshot in time and simplistically assumes an EJ for EJ substitution.2
The results of the substitution are shown the table below. Under both scenarios both Russian pipeline gas and Qatari LNG are completely replaced. In the more modest scenario, 66% of coal consumption is also replaced, and in the buildout scenario, all coal is replaced.
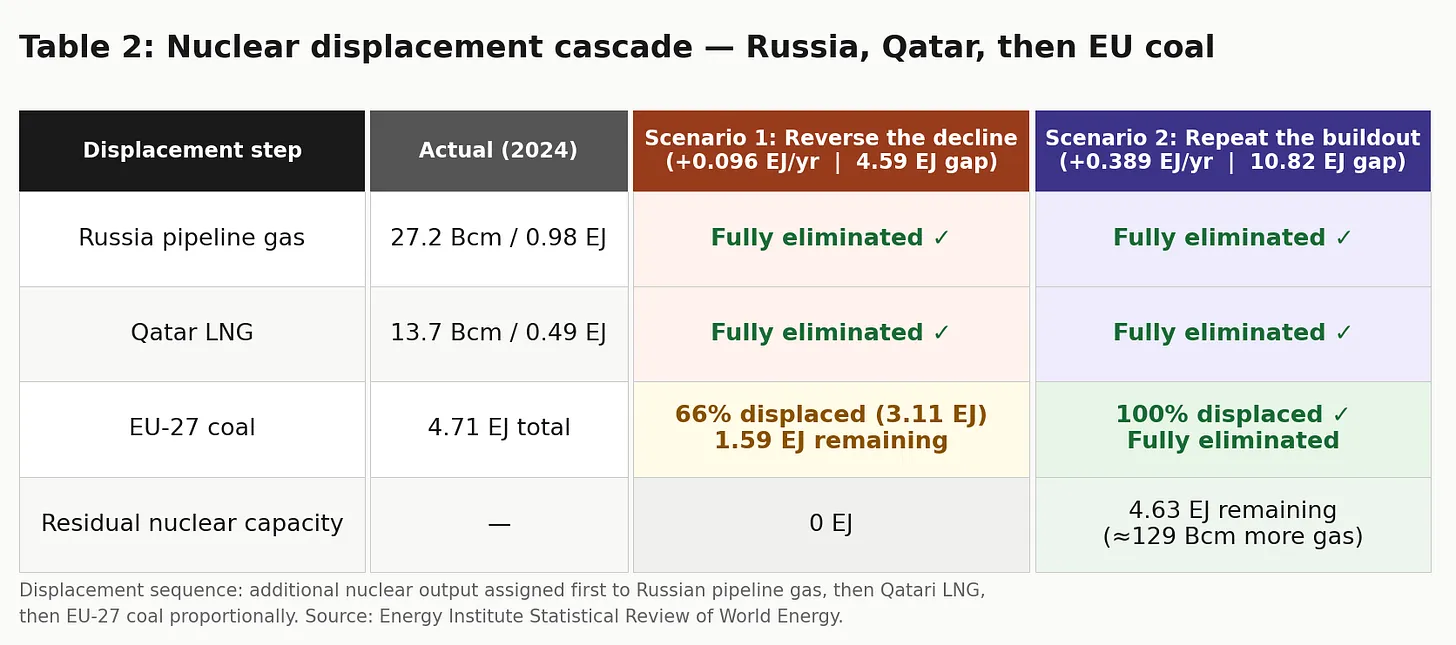
The counterfactual nuclear gap in the Reverse the Decline scenario is 4.6 EJ — more than three times the combined Russia-plus-Qatar imports of 1.5 EJ. In terms of the amount of energy, the EU-27 could have eliminated these imports.
Reverse the Decline then further displaces two-thirds of EU coal, leaving roughly 1.6 EJ concentrated in Germany and Poland. Repeat the Buildout eliminates all EU coal and still has 4.6 EJ of surplus capacity.
The table below shows the implications of the counterfactuals for EU-27 carbon dioxide emissions — which would be ~15% to ~21% less in 2024 than actual. In addition to a strategic error, departing from nuclear cost the EU-27 significantly in terms of another priority of the bloc — emissions reductions.
The figures below show EU-27 energy consumption under each counterfactual scenario. Actual nuclear, gas and coal through 2024 are shown; the dashed counterfactual lines diverge from the 2004 peak, consistent with the displacement sequence above.
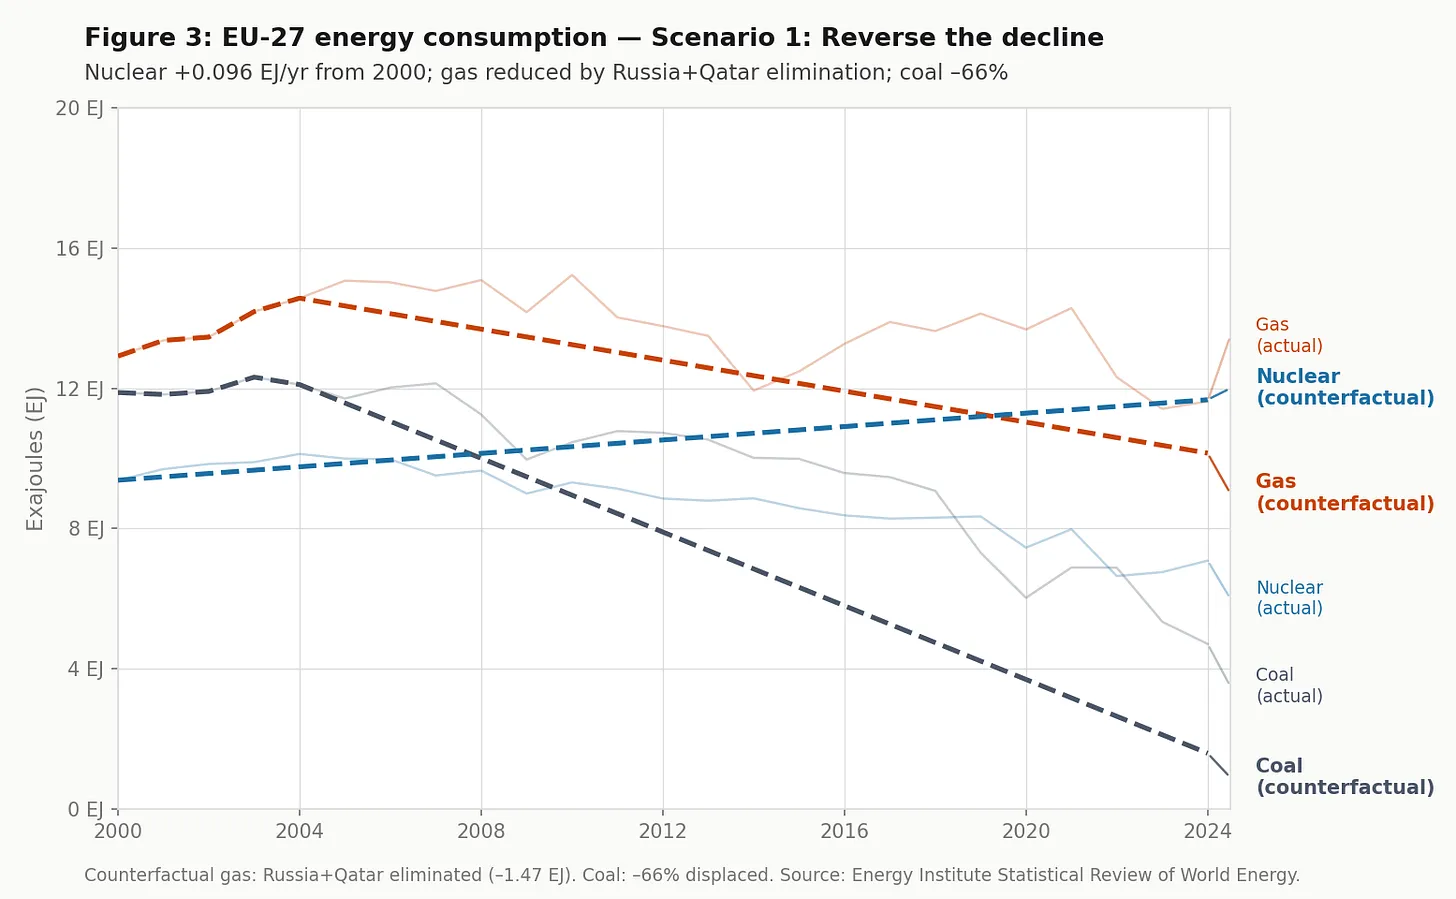
Bother counterfactuals show nuclear eclipsing gas and coal fading away.
Ursula von der Leyen is absolutely correct that Europe’s choice to reduce reliance on nuclear power was a strategic mistake. The choice also dramatically slowed down Europe’s commitment to deep decarbonization. The counterfactual scenarios considered above make that clear.
European energy politics over the past four years have been defined by two crises: Russian gas leverage following the 2022 invasion of Ukraine, and the 2026 Middle East supply disruptions with their knock-on effects on gas prices. These crises could have been avoided, or at least, deeply mitigated.
There is growing recognition across Europe that its choices related to nuclear power were mistaken. Von der Leyen’s €200 million guarantee in support of small modular reactors is a start to getting back on course, and the EU is not building from zero. However, recovery is going to take a while.