Last month, the Center for Strategic and International Studies estimated that the war in Iran had cost the U.S. Treasury $12.7 billion over the first 12 days of the war.1 If we project that daily cost forward to April 1, we get a total estimate of about $35 billion of more than $210 per IRS tax return or ~$260 per household.
I was curious about how much the war has U.S. consumers beyond the direct costs to the government, and how high those costs might get if the war continues. The post reports what I’ve learned so far. All data and links to sources can be found in an Excel file at the bottom of this post, for paid THB subscribers.
The categories I have explored include fuel costs — gasoline, diesel, jet fuel, along with fertilizer costs and the impact on equites. The summary table below shows costs for fuels, fertilizers, and market cap losses, through April 1. For fuels and fertilizers the table projects three scenarios through June 30 — current prices extended, current prices + 25%, and current prices -25%. The September 30 projection just shows current prices extended.
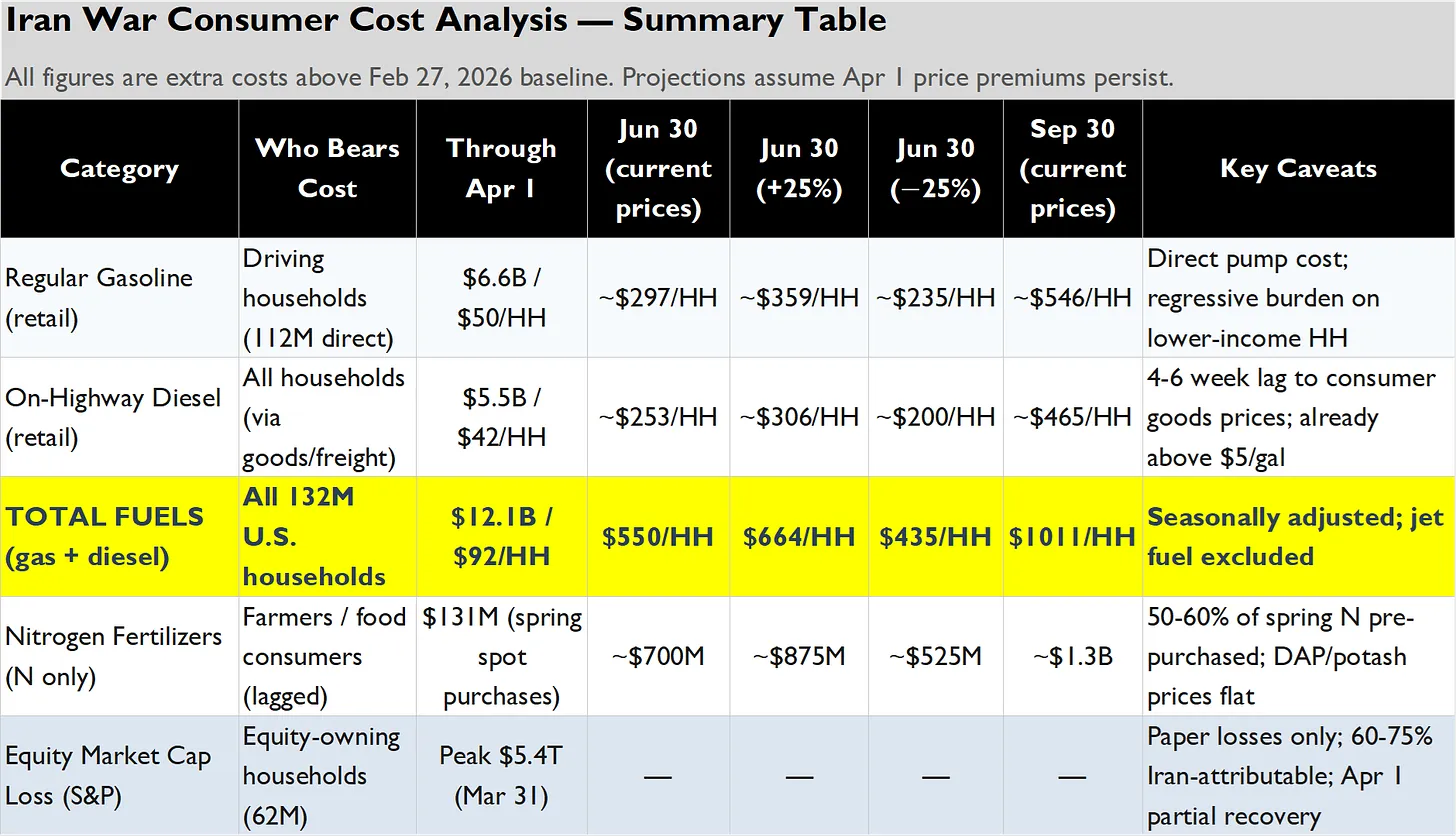
The fuel and fertilizer costs together represent an average cost to each U.S. household of ~$75 per month since the start of the war and going forward ~$150 per month at April 1 prices. If we add everything up, including the public costs, then overall Americans are paying about $1.4 billion dollars per day because of the war, based only on the costs estimated in this post.
For the average U.S. household, that equates to ~$410 per month.2
The following sections explore the particulars, with details provided in a methods appendix below this post.
Fuels: Gasoline, Diesel, Jet Fuel
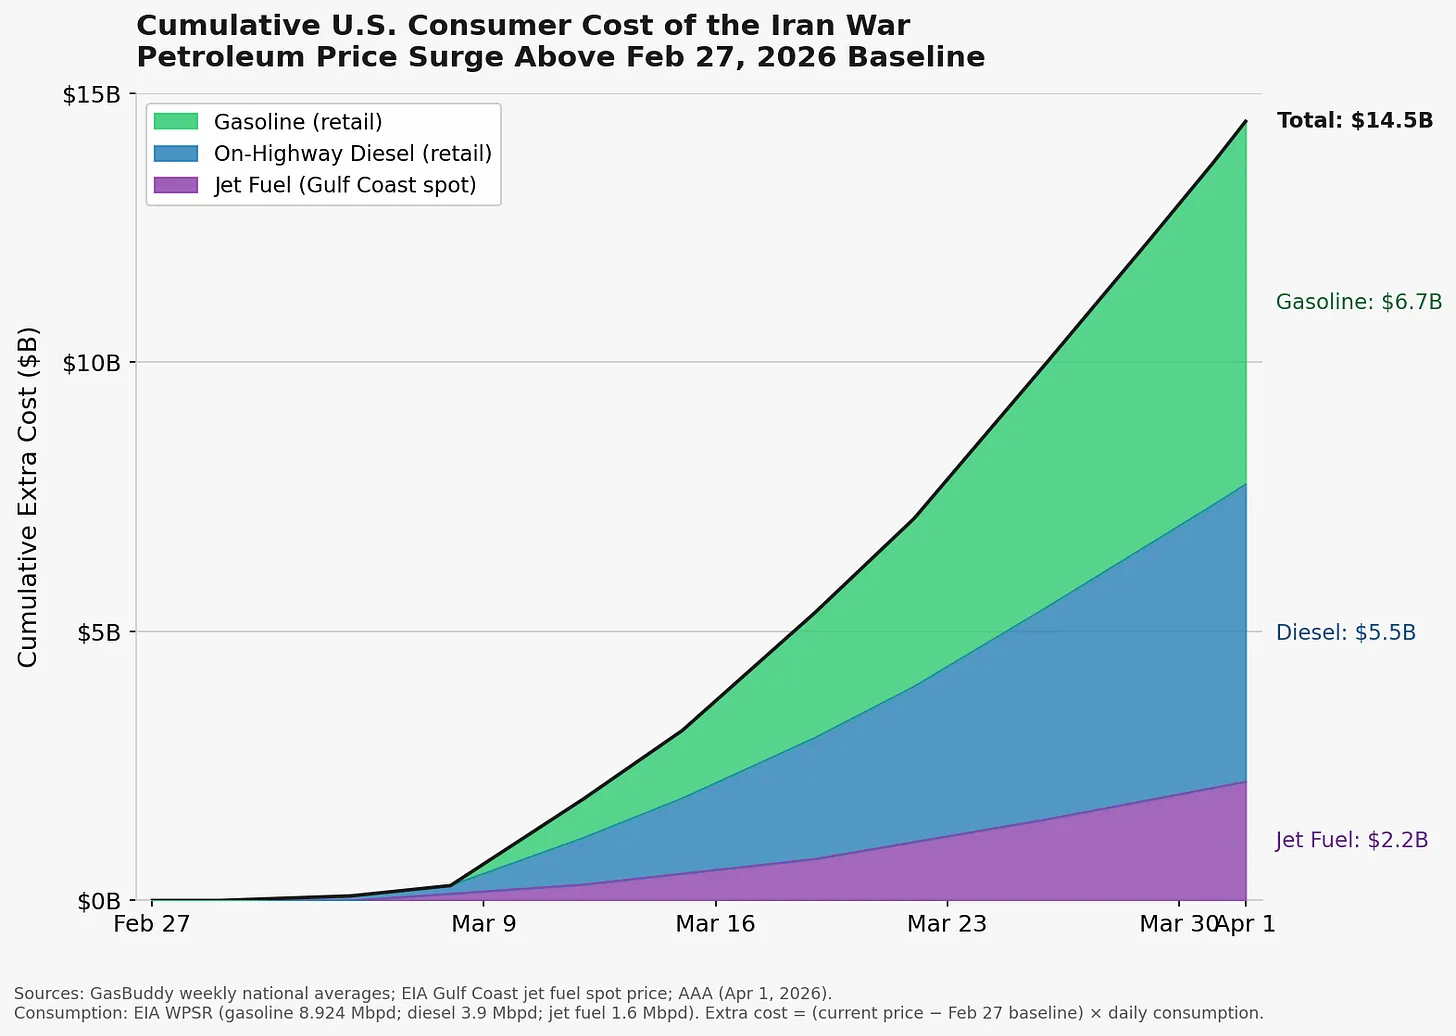
The figure below shows the cumulative costs of the war for the three fuels are approaching $15 billion as of April 1.
The next figure projects these cumulative costs out to June 30th, under three scenarios.
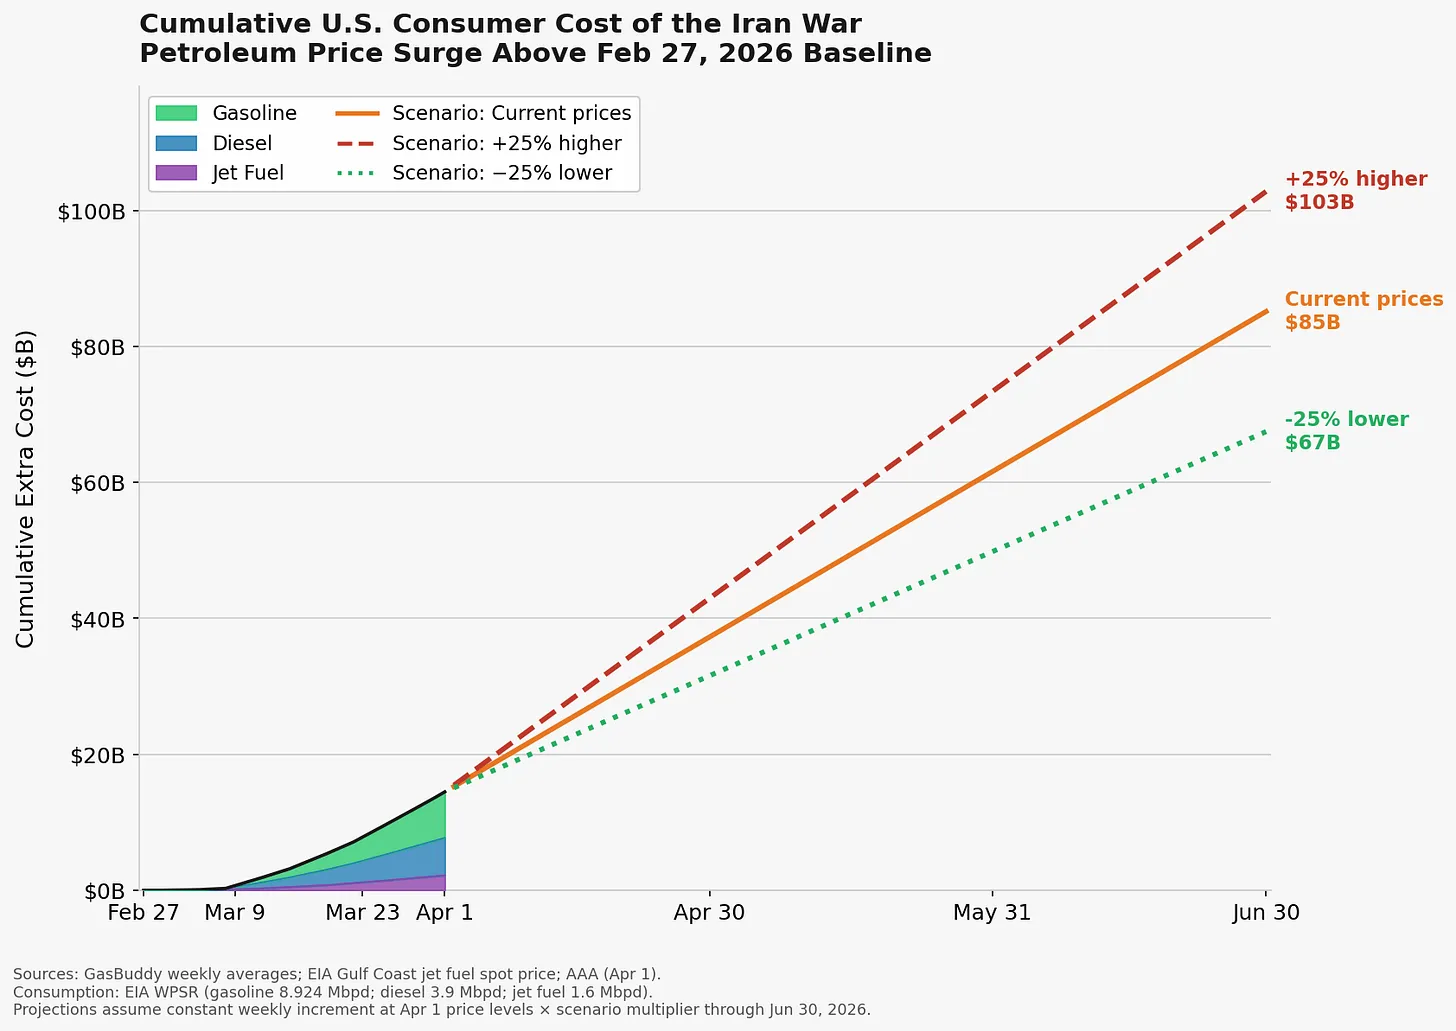
Using the upper scenario, a $103 billion cumulative additional expenditure on fuels through June 30 would equate to ~0.3% of CBO’s estimated 2026 U.S. GDP. If that rate of increasing cumulative costs were to continue through the final two quarters of the year, then that additional expenditure would approach ~1% of U.S. 2026 GDP. That represents money spent by businesses and consumers on fuel that they otherwise would have spent throughout the broader economy. Some amount of GDP growth would likely be sacrificed as well.
Let’s next take a closer look at each liquid fuel.
Gasoline
The cumulative costs of gasoline expenditures, through April 1 work out to ~$6.7B or ~$50 per household. If gas prices remain where they are that cost will increase to about $300 per household by June 30, and almost $550 by September 30.
If oil-prices-to-pump-prices have lag of two to four weeks then that means that pump prices in late March reflected oil prices from mid-March when Brent was around $95–100 per barrel. With Brent now around $110, prices at the pump haven’t fully caught up. Patrick De Haan, GasBuddy’s head of petroleum analysis, warned that a $4 national average breaches a “psychological wall” and flagged the potential for $5+ if the Strait of Hormuz situation doesn’t improve.
Who bears this cost? Everyone who buys gasoline: notably the ~120 million car-owning households which hold about 93% of all Americans. The gasoline burden is regressive. Lower-income households spend a larger share of their income on fuel.
Diesel
The cumulative costs of diesel expenditures, through April 1 work out to ~$5.5B or ~$42 per household.3 If diesel prices remain where they are today, then that cost will increase to ~$250 per household by June 30, and >$450 by September 30.
The on-highway diesel price rose from $3.77/gallon on February 27 to $5.45/gallon by April 1 — a ~45% increase. According to GasBuddy, it was the highest level since July 27, 2022, and De Haan warned it could approach $6 per gallon .
Diesel is not primarily a consumer fuel. But every American household is a diesel consumer because everything that arrives at a store — groceries, construction materials, furniture, online orders — are moved by diesel-powered trucks. The American Trucking Associations estimates that 72.5% of all U.S. freight by value moves by truck.
Who bears this cost? In the short run, trucking companies do through reduced margins. Ultimately, trucking companies pass the cost to retailers and retailers pass it to consumers — typically with a weeks-to-months lag, which would means that any diesel-driven inflation would be just now start showing up in store prices. Last week, Secretary of Energy Chris Wright suggested that the administration has “ideas on diesel” to bring extra supply to market.
Jet Fuel
While I have excluded jet fuel from the per-household calculation, increasing prices have real costs across the U.S. economy. Gulf Coast spot jet fuel rose from $2.47/gallon on February 27 to approximately $4.20/gallon by late March, a 70% increase. Airline fuel costs pass through to ticket prices with a significant lag and are not directly borne by households as a retail price. However, they are a cost to the estimated 120 million Americans who fly at least one commercial flight each year. Including jet fuel in the national cost estimate adds approximately $2.2 billion to the five-week cumulative figure ($14.5B total vs. $12.2B for gas+diesel alone).
Fertilizer and Farmers
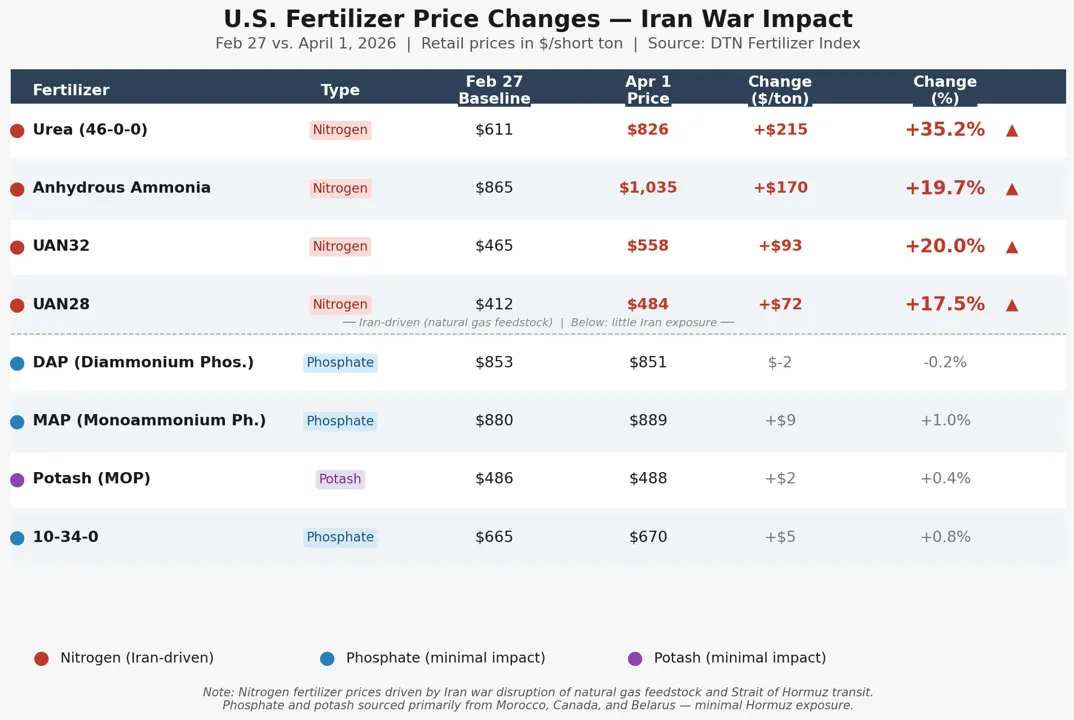
Iran is a major producer of urea and ammonia, which use natural gas as a feedstock. DTN’s weekly retail price index, which surveys U.S. agriculture retailers, shows the following price changes from the February 27 baseline through April 1, for nitrogen-based fertilizers (using natural gas) and non-nitrogen-based fertilizers (not using natural gas). You can see the effect of the war on the nitrogen-based fertilizers.
Who bears the costs of increased prices for agricultural inputs?
In the U.S., eventually all food consumers will eventually bear some of the cost of increased fertilizer prices, with a longer lag. Higher input costs show up in commodity prices and ultimately in grocery bills, though the transmission is slow and the crop-growing season gives some buffer. Outside the U.S., increasing fertilizer prices present profound risks of food crises — worth a future post here at THB.
Farmers who purchased fertilizer prior to the war are substantially sheltered. It is standard practice for U.S. corn and wheat farmers to lock in fertilizer prices months before spring application. Anyone buying at current spot prices are paying 20–35% more than they would have a month ago.
The cumulative cost estimate of $131 million through April 1 is a rough estimate cobbled together from multiple sources — I’d particularly welcome input from agricultural economists on how this estimate might be improved.4
Equity Markets
Equity markets are different than the fuel and fertilizer costs above, as losses are only realized when there is a sale of a security. However, the drop in value of equities after the war started is worth quantifying.
The S&P 500 closed at 6,878.88 on February 27. It dropped steadily through March, falling to 6,344 on March 31 — a 7.8% decline from the baseline. Against a total U.S. equity market capitalization of approximately $69.5 trillion, the drop in equity values implies ~$5.4 trillion in market cap lost as of March 31. You can see the equity value lost on paper in the figures below.
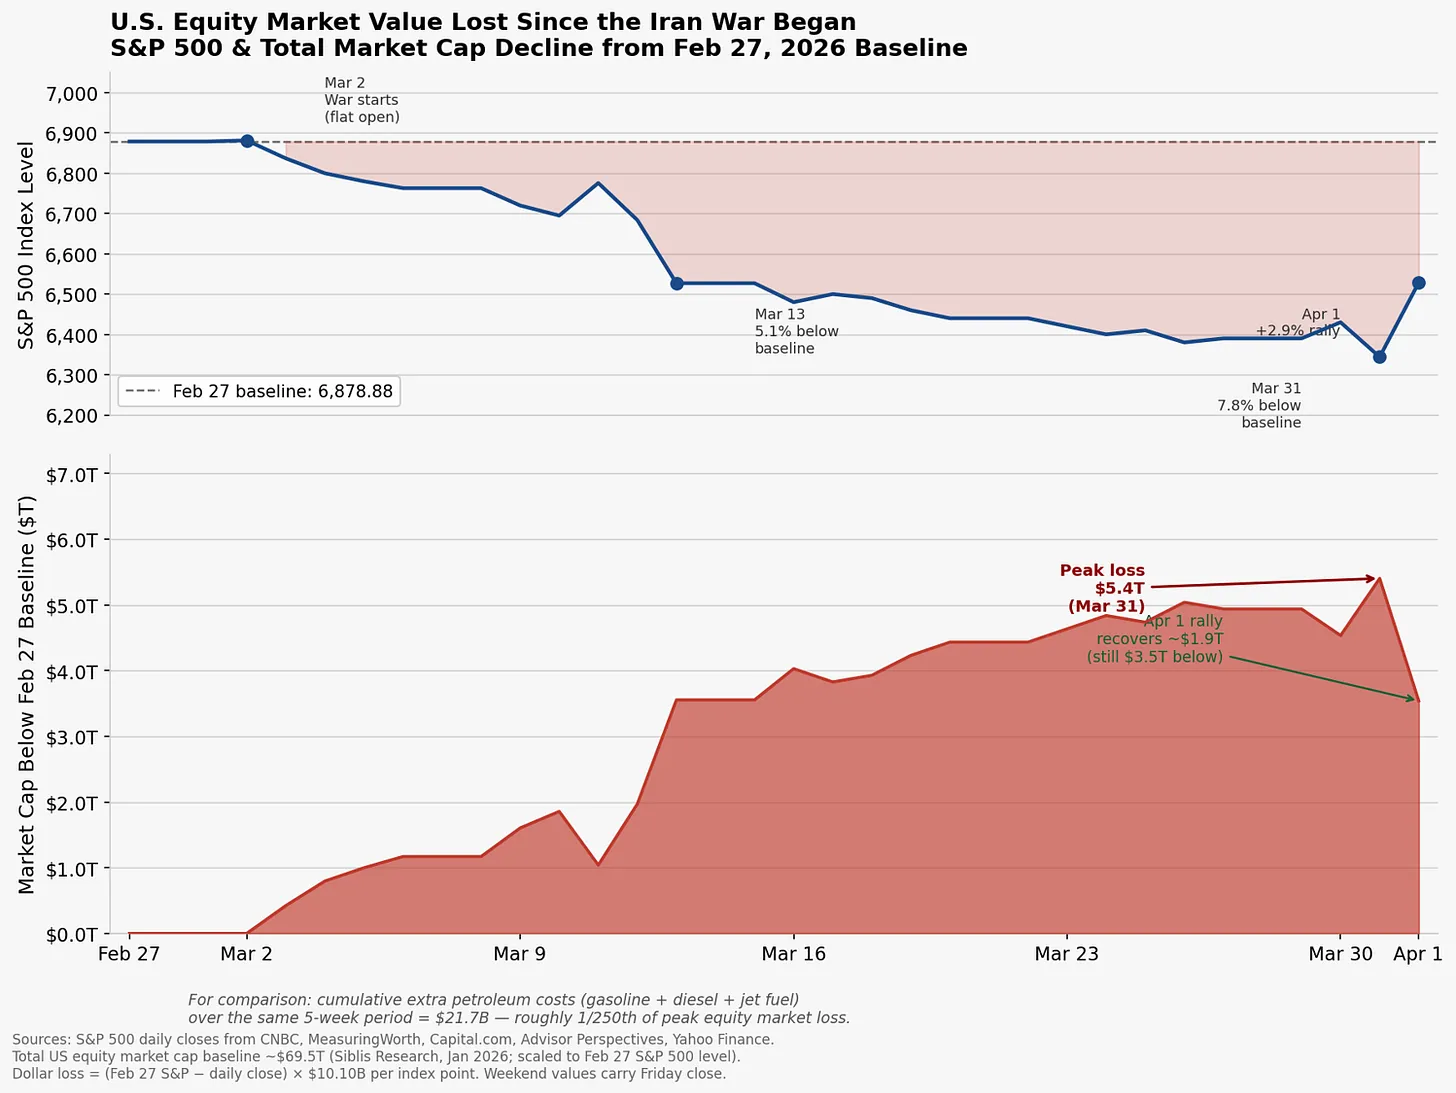
The loss of equity in these holdings affects the ~80 million U.S. households with equity exposure (through 401(k)s, IRAs, or direct holdings).
What Comes Next?
Writing earlier today, oil analyst Rory Johnson writes at his Substack, Commodity Context:
It’s now increasingly looking like the best case scenario is that the Strait of Hormuz is closed for another full month. In the meantime, we can expect more military escalation and, with it, additional and potentially more serious upstream infrastructure attacks. Even if the US military operation only lasts for two more weeks, it’s unlikely that any post-operation reopening of the Strait could occur by the end of April. This means that the ultimate oil market cost of the Iran War, as measured by unproduced Gulf barrels, is on track to top one billion barrels this year.
That would seem to bring the June 30 numbers that I estimate above realistically into play. Keep in mind that the +/-25% scenarios are not upper or lower bounds.
What we can say for sure is that the Iran war has already cost American consumers a lot, and it looks certain to cost a lot more.