Yesterday, The Washington Post published what can only be described as a hit piece on the nominee for Secretary of Energy, Chris Wright. The Post took issue with Wright’s claim that:
“[R]eports from the Intergovernmental Panel on Climate Change (IPCC) actually show no increase in the frequency or intensity of hurricanes.”
The Post claimed that Wright was misrepresenting the most recent IPCC assessment report. But rather than quoting the IPCC itself to show where Wright may have been wrong, The Post instead relied on a characterization of the IPCC from one of its contributors (emphasis added):
“He [Wright] is demonstrably misrepresenting [the IPCC] report,” said [Jim] Kossin, who said the IPCC report shows warming is making storms more intense. “It is extremely easy to show that. It is all there in black and white. There is no gray area.”1
Let’s do what The Post did not and take a look at what the IPCC actually concluded about trends in tropical cyclones:
“There is low confidence in most reported long-term (multidecadal to centennial) trends in TC frequency- or intensity-based metrics . . .”
Sounds like there might be a bit of gray area, no?
Take it also from MIT’s Kerry Emanuel, who is more bullish on human influences on tropical cyclones than the IPCC or most of his peers, but also recognizes that current understandings are far from black and white:
“At present, there is little scientific consensus about trends in global or regional [tropical cyclone] activity, either in the past, as detected in observations or in climate model simulations, or in the future as our climate continues to change.”
The Post’s reporting reminds us that there is a lot of misinformation out there related to climate, and hurricanes in particular. With The Washington Post and an IPCC author apparently willing to misrepresent what the IPCC concluded on hurricanes in service of a political hit, it can be very difficult for curious non-experts to know what’s what.
Today I share a range of data summarizing the 2024 North Atlantic hurricane season, with a focus on continental U.S. landfalls.2 Given how polluted the information environment is around climate, I encourage you to check and challenge the data. In 2024, relying on “scientists says” is, regrettably, not a particularly reliable way to the truth.
Season Summary

The figure and table above show summary statistics for overall seasonal activity. By all metrics, 2024 was a very active season in historical context — the 12th most active in the past 74 years or about the 85th percentile. The continental U.S. saw five hurricane landfalls — 2 major (Category 3+ = Helene and Milton) and 3 minor (Categories 1 and 2 = Beryl, Debby, and Francine).
Based on work in progress (with the inestimable Jessica Weinkle), we estimate that the continental U.S. saw about $89 billion in direct economic losses from these five storms, which is exclusive of inland flood damages — following the methodology of our 2018 paper on normalized hurricane losses, which we are currently updating through 2024 for submission to a peer reviewed journal.
In terms of human impacts beyond the economic, 2024 was particularly deadly with respect to inland flooding, with approximately 400 people perishing due to the storms — especially Hurricane Helene in the Appalachian mountains. That is the most storm-related deaths since 2005 and Hurricane Katrina. Almost 20 years ago we published a paper arguing that inland flooding from hurricanes was an underappreciated threat.
Continental U.S. Landfall Trends Since 1900
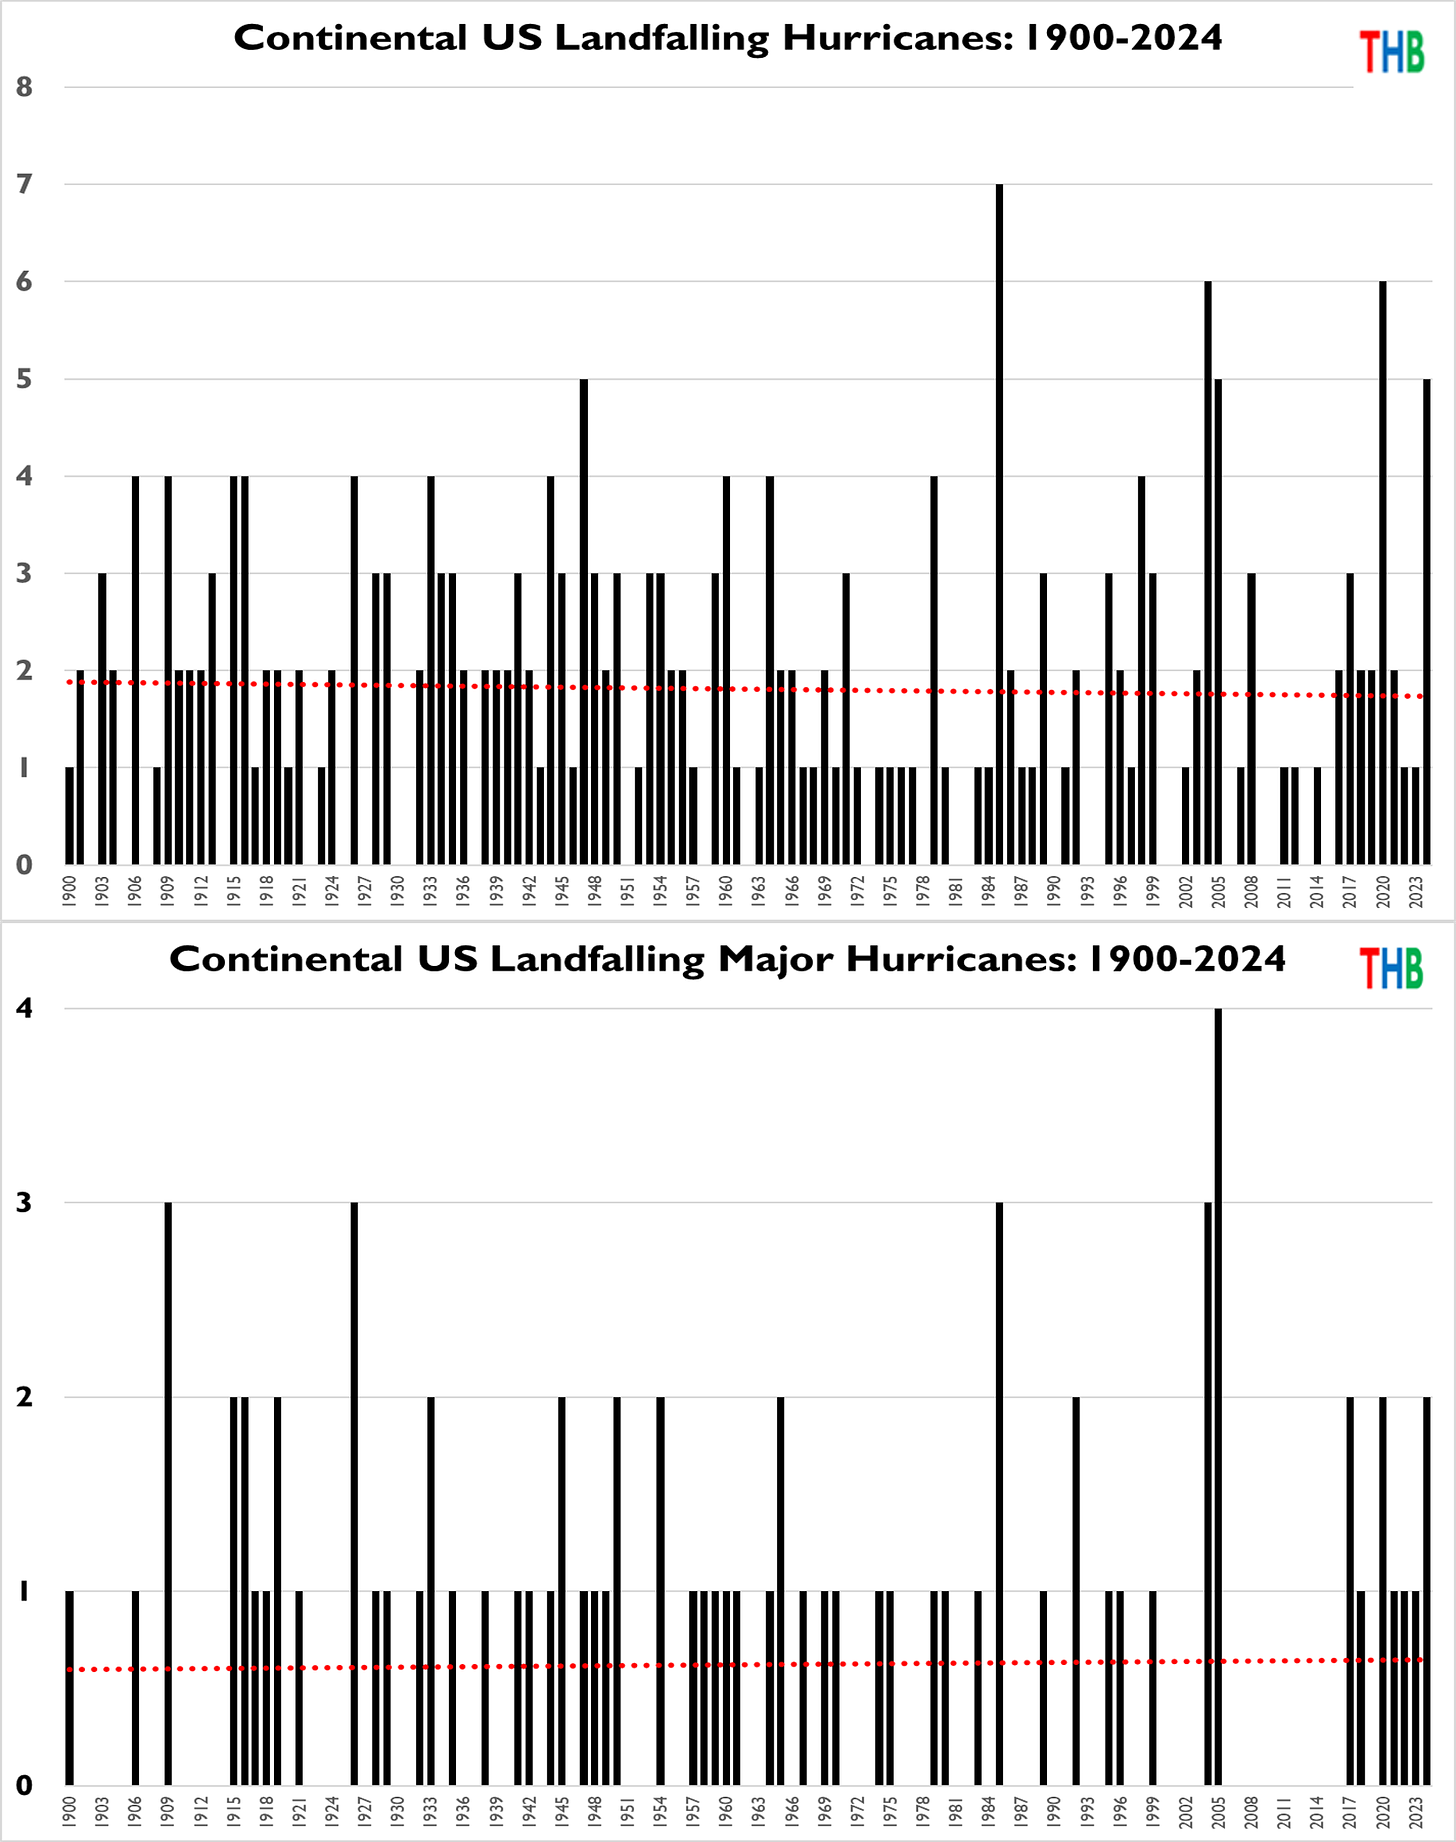
The figures above show long-term trends in continental U.S. hurricane landfalls. The last 8 years have seen a lot of major hurricane landfalls. The 8 years before that saw none. Since 1900 there are no trends in either variable.
Trends in North Atlantic and Global Storm Intensity

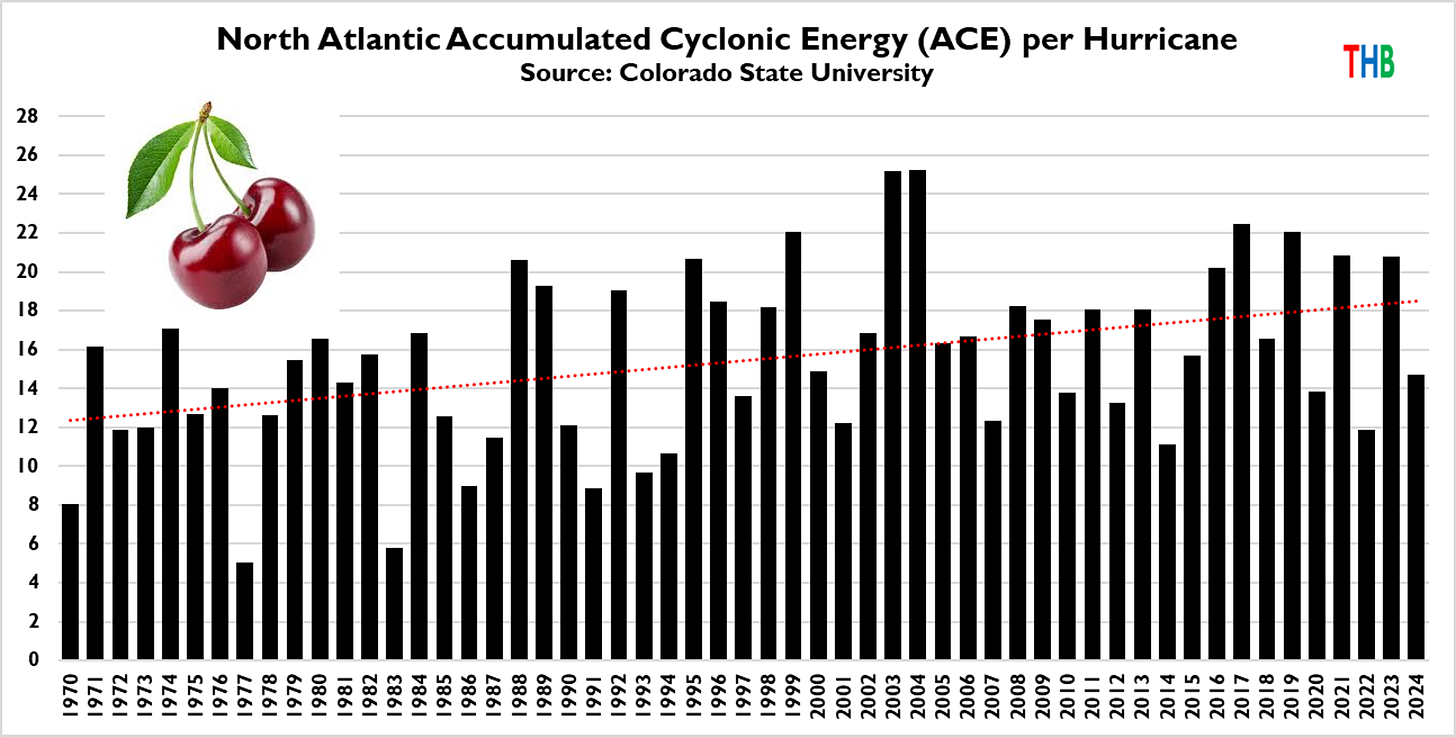
The figure above shows ACE per hurricane in the North Atlantic since 1900. There is considerable variability, but no overall trend (dashed red line). By this metric, North Atlantic hurricanes have not overall become more intense since 1900.
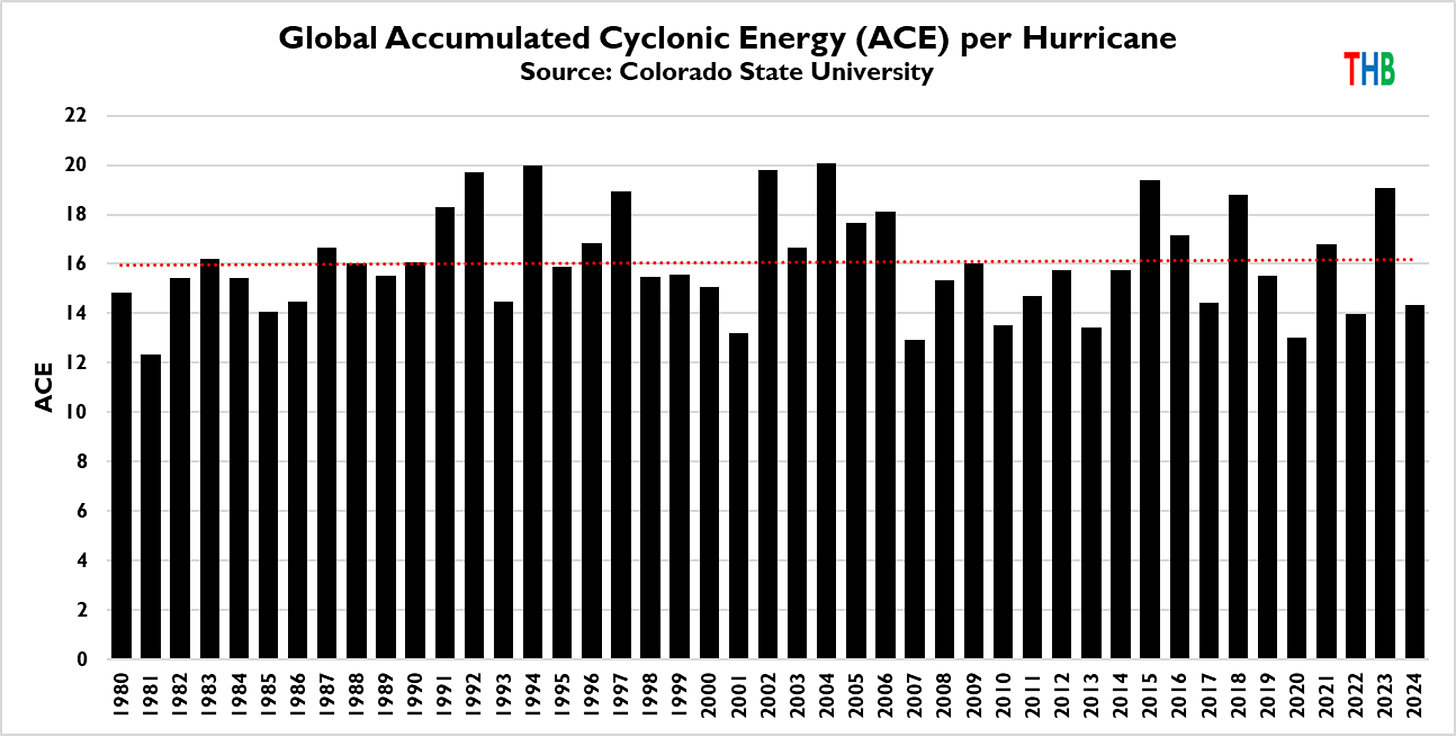
The figure above shows the same variable — ACE per hurricane — globally, and shows no trend since 1980 (which is the first year available from CSU, based on data quality issues prior to that). Note that while the North Atlantic was active in 2024, most of the rest of the world saw a relatively inactive year by recent historical standards.
But what if you really, really want to show alarming, upwards trends? Here is what you do: Using ACE, identify the most inactive period for North Atlantic hurricane activity in the past 125 years. That happens to be the period 1970 to 1979. Then, start a trend analysis in 1970. Voila!
Normalized U.S. Hurricane Damage 1900 to 2024
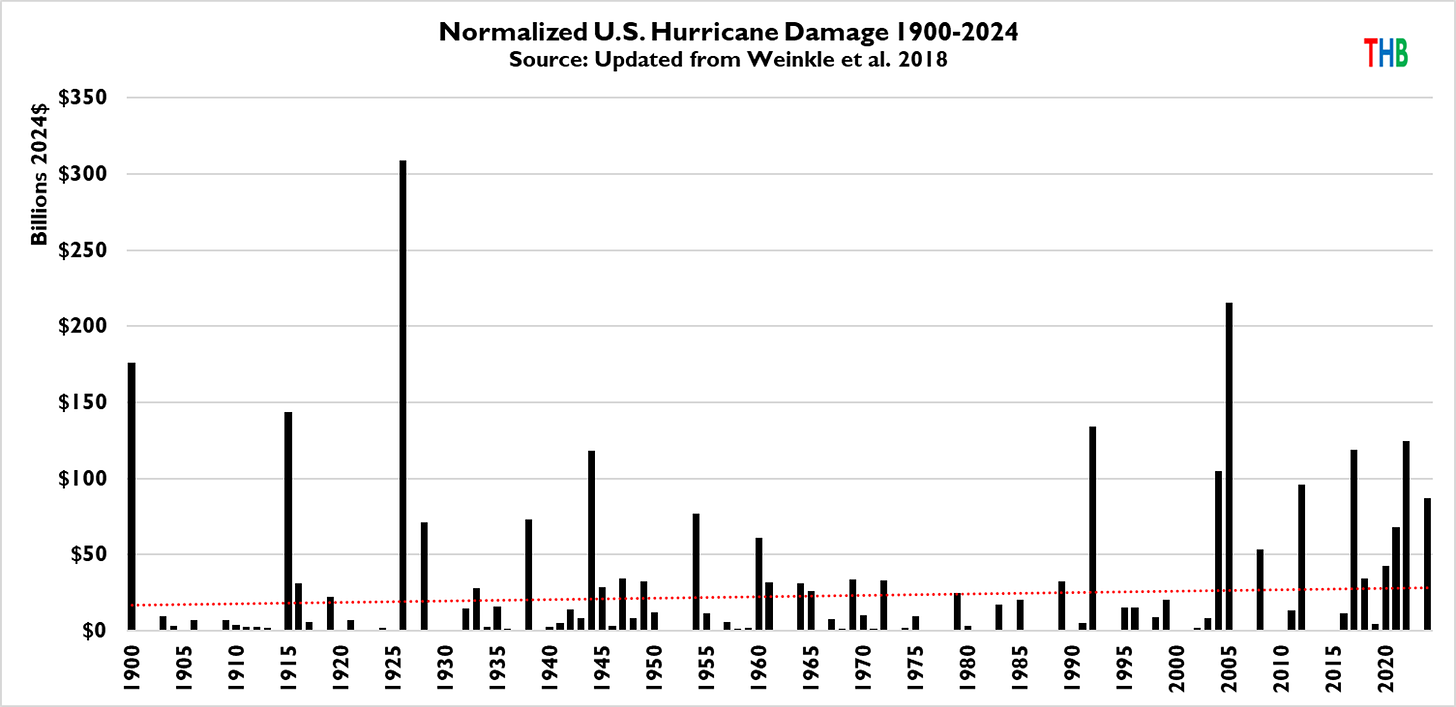
The figure above updates our time series of normalized continental U.S. hurricane losses, with 2024 just making it into the top 10% of annual losses over the past 125 years. There is no trend in the time series (red dashed line), which is consistent with the lack of trends in landfalling hurricanes or major hurricanes.
Note however that the data in the figure above are updated from our 2018 paper simply using relevant national-level data (in contrast, the 2018 paper uses more granular data, storm by storm). The further in time we get from our 2018 analysis, the more likely it is that the estimates will drift away from more precise values.3
Consider that the graph above suggests that the 1926 Great Miami Hurricane, were it to occur in 2024, would result in losses exceeding $300 billion — more than 3 times the estimated losses of the five landfalls of 2024. In our current work-in-progress, Jessica Weinkle and I estimate (preliminarily) that the 1926 storm would actually exceed $390 billion in 2024. Our paper will discuss the reasons for this very large increase, with significant recent inflation and accumulating wealth and population expected to be a big part of the story.
Seasonal Hurricane Forecasts
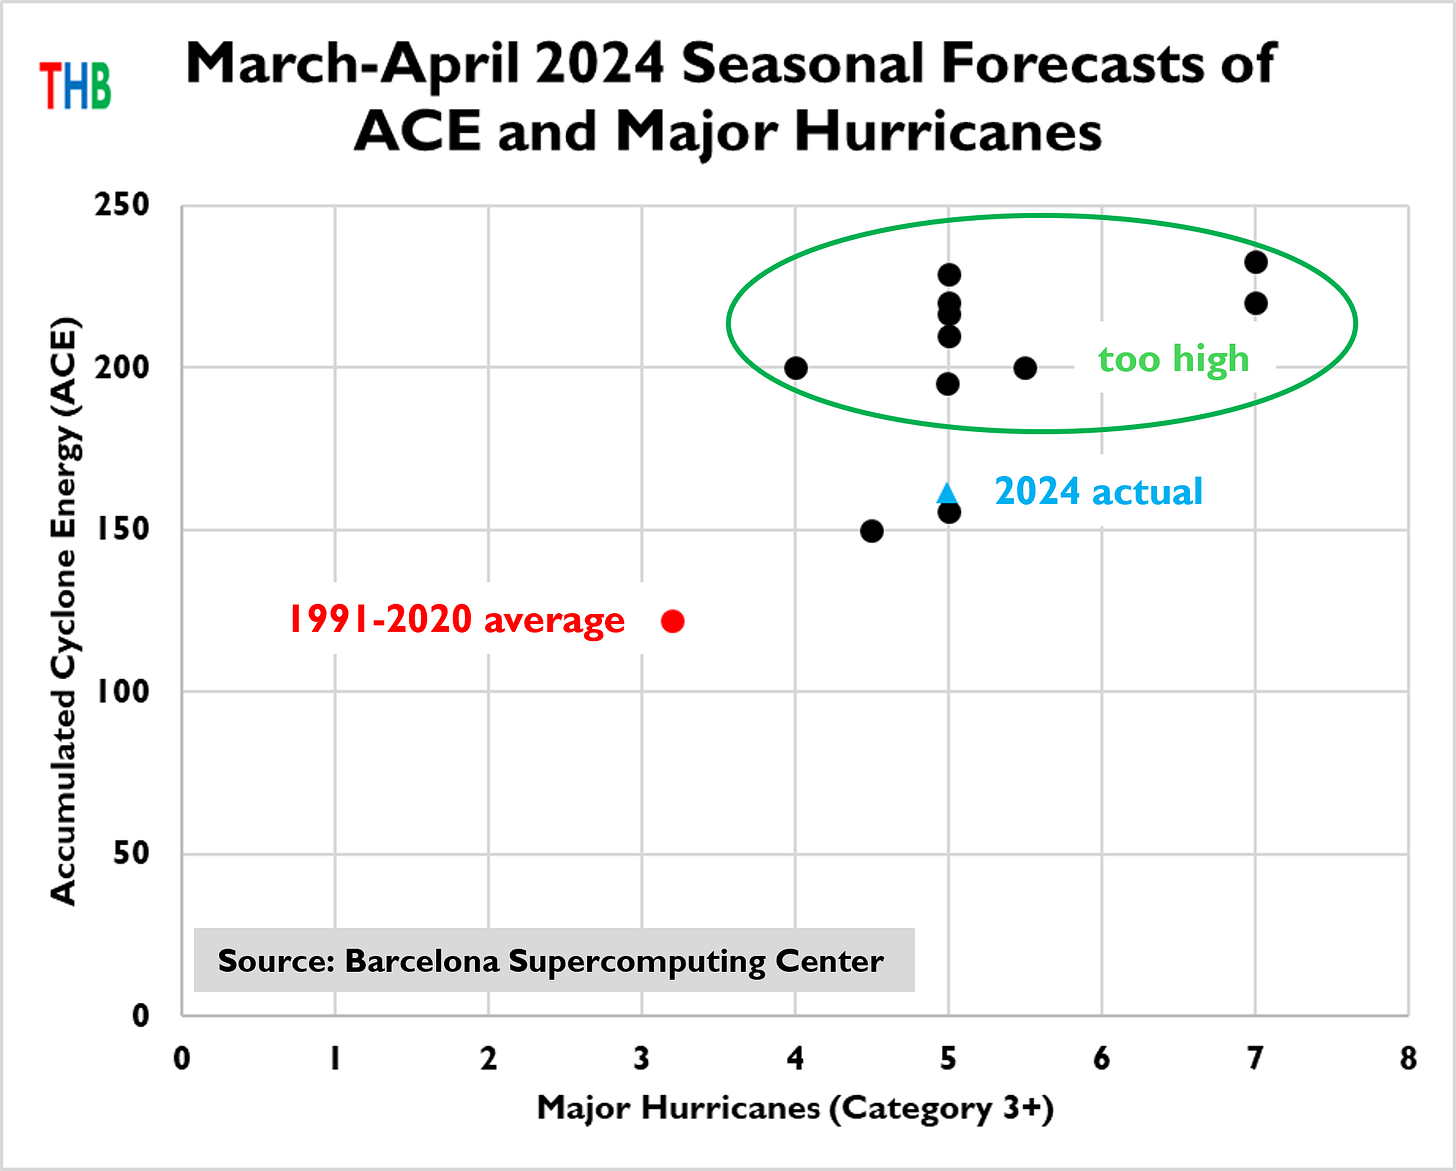
The figure above shows how seasonal hurricane forecasts — that is forecasts made earlier in the year before the hurricane season began — performed versus climatology (the red dot).4 Overall, the forecasts were directionally correct but quantitatively too aggressive. A few forecasts were very close to the actual results. For a rigorous effort to evaluate the skill of seasonal forecasts over time, have a look at this report by Phil Klotzbach and colleagues at Colorado State University. Of note, Michael Mann of the University of Pennsylvania predicted 33 named storms (there were 18) due to human-caused climate change, which would translate to an ACE value of about 300, far above the top of the Y-axis in the figure above (using the average ACE per storm of 2024).
Continental U.S. Hurricane Landfalls by President
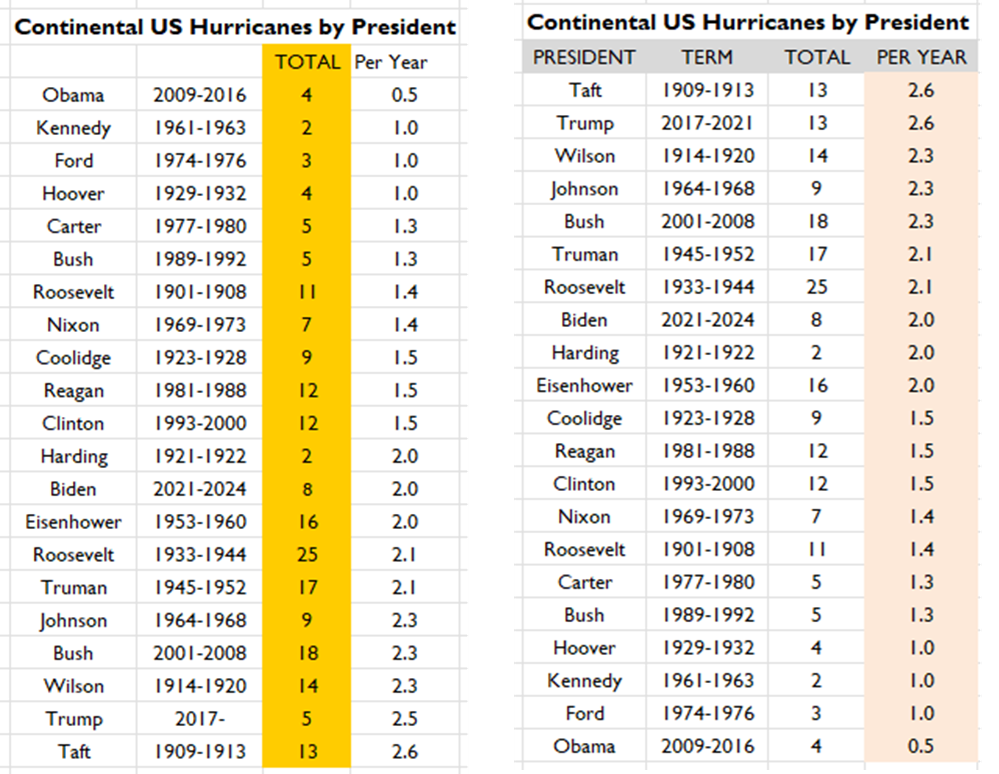
Finally, a bit of fun with some meaningless data. The figure above shows U.S. hurricane landfalls by president. President Biden sits in the middle of the pack with Presidents Harding and Eisenhower. A second term President Trump will have a chance to continue his efforts to best President Taft as the president with the most hurricanes during his term in office. President Obama’s record hurricane inactivity over his two terms is likely to stand for a while — Thanks Obama!
This article was originally published on Roger’s Substack, The Honest Broker. If you enjoyed this piece, please consider subscribing here.
1 For those wanting to dive a bit deeper — Kossin’s research was the subject of a significant error in the IPCC and a failure of IPCC quality control procedures. Read about that here, based on a tip from an IPCC insider.
2 Soon after the new year, Ryan Maue and I will have a similar analysis of global landfalls for 2024.
3 This drift has a technical name: assumption drag.
4 These are just a subset of the variables and forecasts you can find documented at the Barcelona Supercomputer Center.


