Last week I was playing around with the data of the Energy Institute’s 2025 Statistical Review of World Energy and I created a figure that went a bit viral on social media and resulted in some constructive comments.1 That figure, shown below — which I called “a simple metric of energy security among the G20” — shows a simple ratio of domestic energy production to domestic energy consumption.
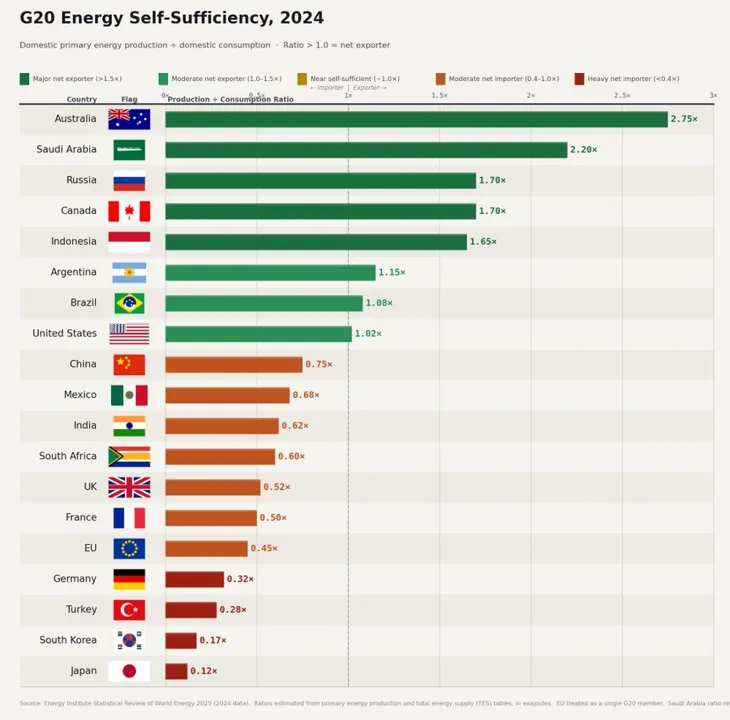
Several commenters observed that Australia has a high dependency on imported liquid fuels, even though it is also a huge exporter of fossil fuels, and so its placement at the top of this table was apt to be misleading. They were correct — Clearly, a production to consumption ratio is notable but also insufficient to assess domestic energy security.
So I’ve spent some time thinking on how to create an index that is still simple and intuitive, but which better reflects energy security. Today I share what I’ve come up with.
I am focusing on direct energy self-sufficiency, not energy independence. As I discussed last week with respect to renewables,2 energy dependencies are highly complex, and the reality is that every country has significant energy dependencies.
By self-sufficiency I simply mean the extent to which consumption of electricity and fuels used by final consumers is supplied from domestic sources rather than imports.
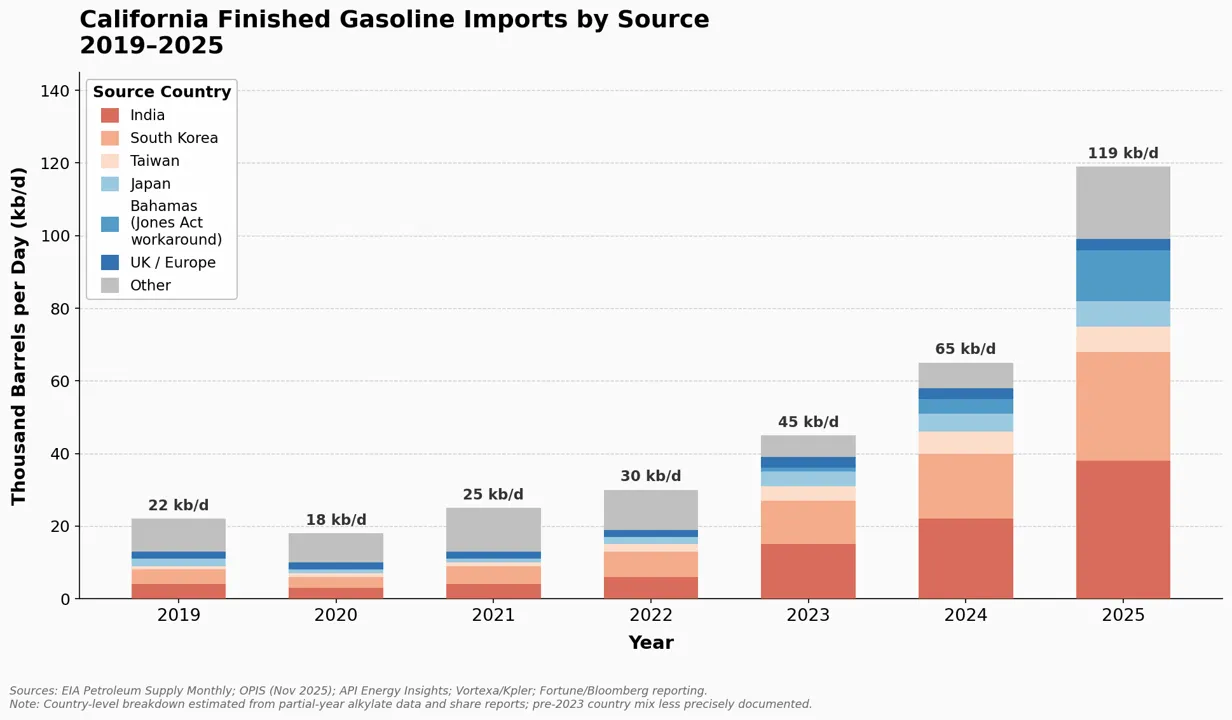
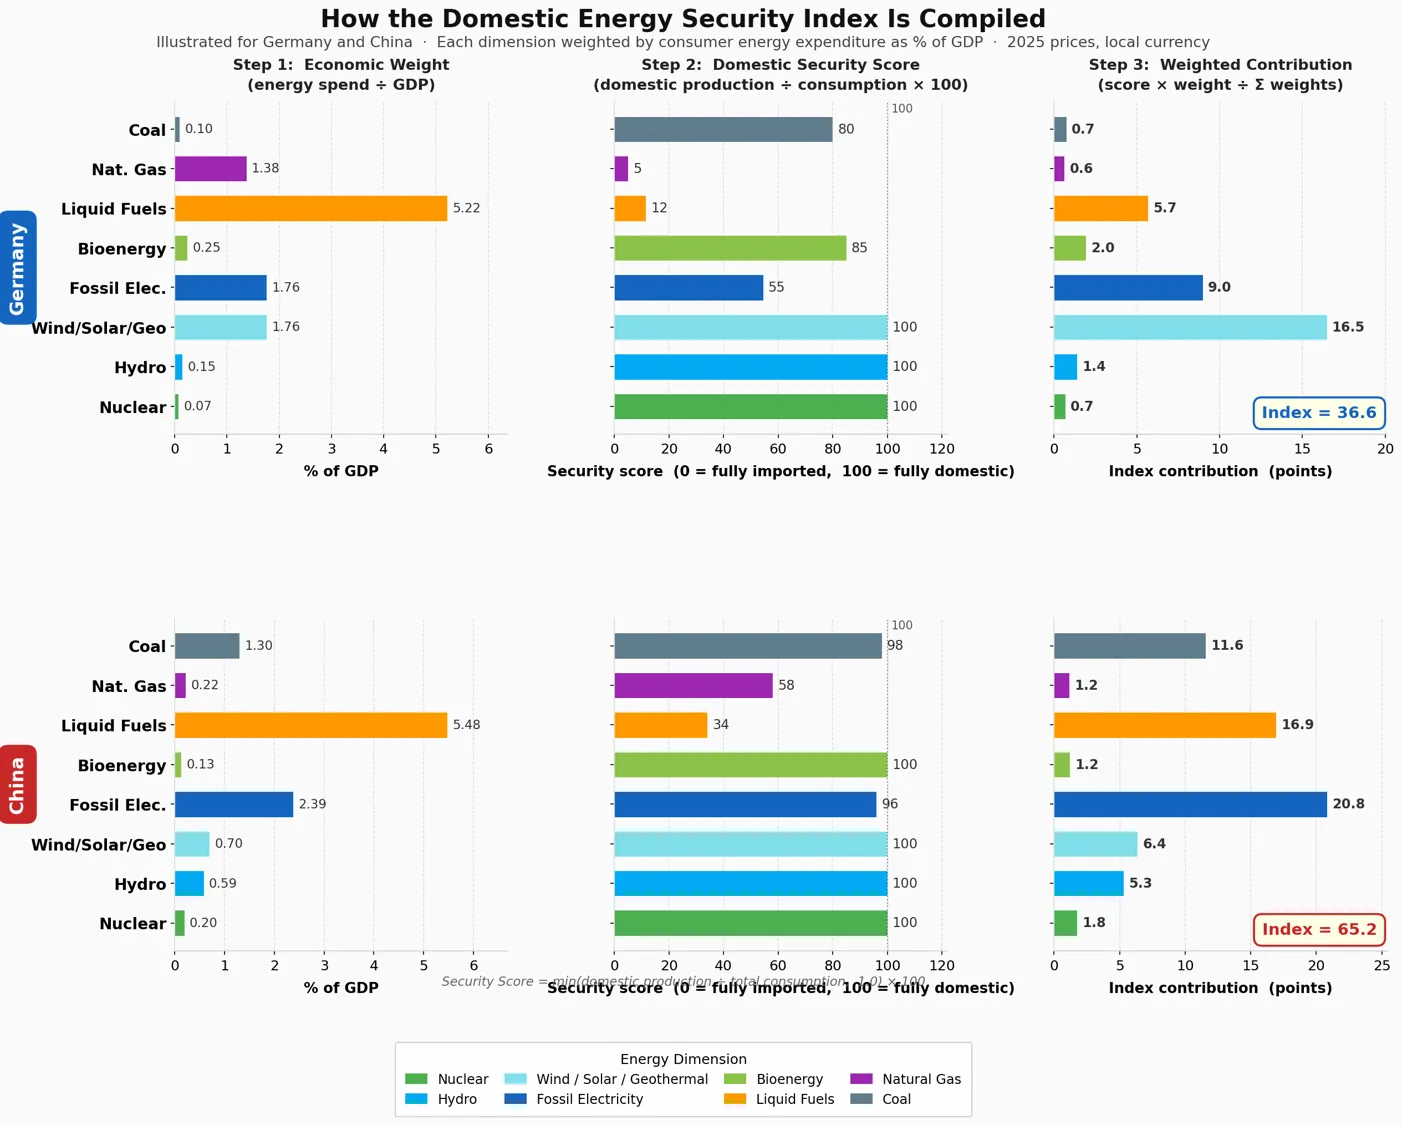
The THB Energy Security Index scores each G20 country across eight energy dimensions: nuclear, hydropower, wind/solar/geothermal, fossil-fuel electricity generation, bioenergy, liquid fuels, natural gas, and coal. Liquid fuel security is measured using crude oil self-sufficiency: domestic crude production divided by total crude supply. There are some complexities that I ignore, such as trade in refined petroleum products, for instance, in California — shown in the figure below. I include bioenergy, as it is important in several G20 countries such as Brazil (sugar cane ethanol) and the United Kingdom (imported wood pellets at the Drax power station).3
For each of the eight energy dimensions I assign a security score between 0 and 100, where 100 means the country produces at least as much domestically as it consumes, and 0 means complete import dependence. I weight each dimension by the share of that fuel in consumer energy expenditure, computed in local currency as a percentage of GDP. The index is then the expenditure-weighted average of the eight security scores — that is, the sum of (score × weight) divided by the sum of weights. The resulting index can range from zero to 100.
The tables below show how the index is created for Germany (36.6) and China (65.2).
The figure below shows the THB ESI for the G20, with the eight components color-coded. You’ll see that Australia falls down the table as compared to the first image I shared in this post.
Some things I found interesting about the index results:
- Russia, Saudi Arabia, and Canada score 100, meaning that they are energy self-sufficient.
- Brazil is at 95: large amounts of hydropower, domestically produced sugarcane ethanol, and near-self-sufficient crude production combine to push it close to full independence, despite limited gas and coal.
- The United States sits at 91 — very close to self-sufficiency.
- China scores 65. China is nearly self-sufficient in coal, which is the primary fuel for its electricity generation and carries one of the heaviest GDP weights in the index. Its main vulnerability is liquid fuels.
- European countries cluster near the bottom of the table, along with Japan, South Korea, Turkey, and South Africa.
I was also curious about what the index would say about each country’s structural exposure to the closure of the Strait of Hormuz, so I estimated how the index would change based on how much oil and natural gas transited the Strait (based on data from January 2025). The results of that sensitivity analysis are shown below, ranking countries by how the crisis would impact their rankings and index scores.
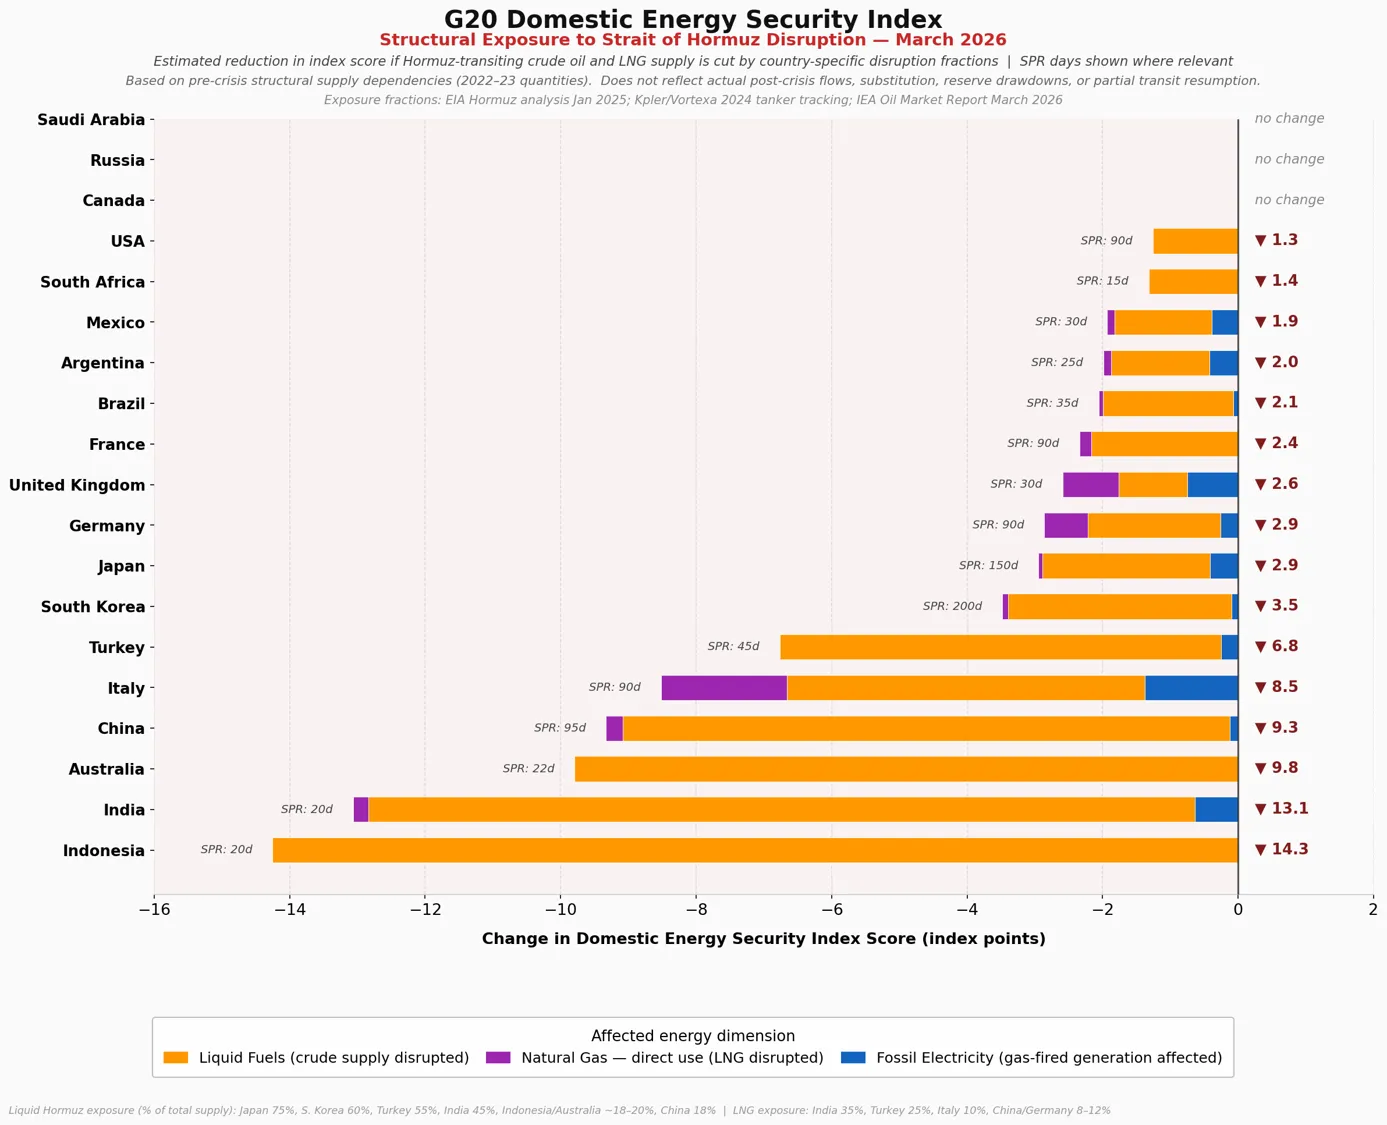
You can see that Australia has one of the largest structural exposures, along with India and Indonesia. In the real world, some countries have made deals with Iran to allow oil to cross the Strait, notably India — The index helped me to understand why.
One consequence of the US/Israel war with Iran will surely be efforts by countries to move up in the index of energy security — whether via fossil fuels, nuclear, or wind, solar or other technologies. Each country will have different priorities — for instance, Australia might push for greater EV adoption, Italy might accelerate its return to nuclear, and Indonesia might expand production of liquid biofuels.
For THB paid subscribers, a spreadsheet with all sources, data, and calculations appears below. This index is work in progress and intended to stimulate my thinking, and also yours. Caveat lector!
PS. To read deeper on this topic, check out this new report from the National Center for Energy Analytics — The Role of Energy in U.S. National Security, by Iddo Wernick and Stephen Eule. It takes a much more technically sophisticated look at energy security as compared to the simplistic one offered in this post.