

In the United States, nuclear power plant construction costs escalated dramatically over decades. In today’s post I argue that those costs did not have to escalate but were the result of policy choices. We know that because some countries avoided a similar cost escalation as they built their nuclear fleets. Understanding that cost escalation was a policy choice is key to understanding options for the role of nuclear power in U.S. energy policy.
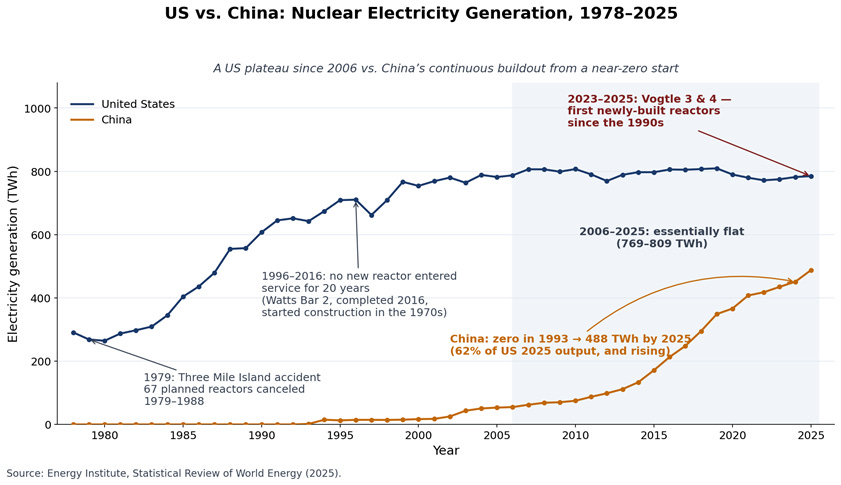
The figure below shows U.S. and China’s electricity generation from nuclear power from the 1970s. For the past two decades U.S. generation has plateaued, while China’s increased by almost 800% over the same period, from a very low base. At China’s current rate of nuclear plant construction, it may exceed U.S. capacity within a decade. Is the U.S. destined to fall behind China in nuclear energy? Can America build nuclear again?
This THB series addresses three questions in three installments:
- Why have construction costs escalated in the U.S. but not in some other countries?
- How has federal policy treated natural gas versus nuclear?
- What policies might be implemented to revive the nuclear industry?
Let’s get started.
Historical construction costs
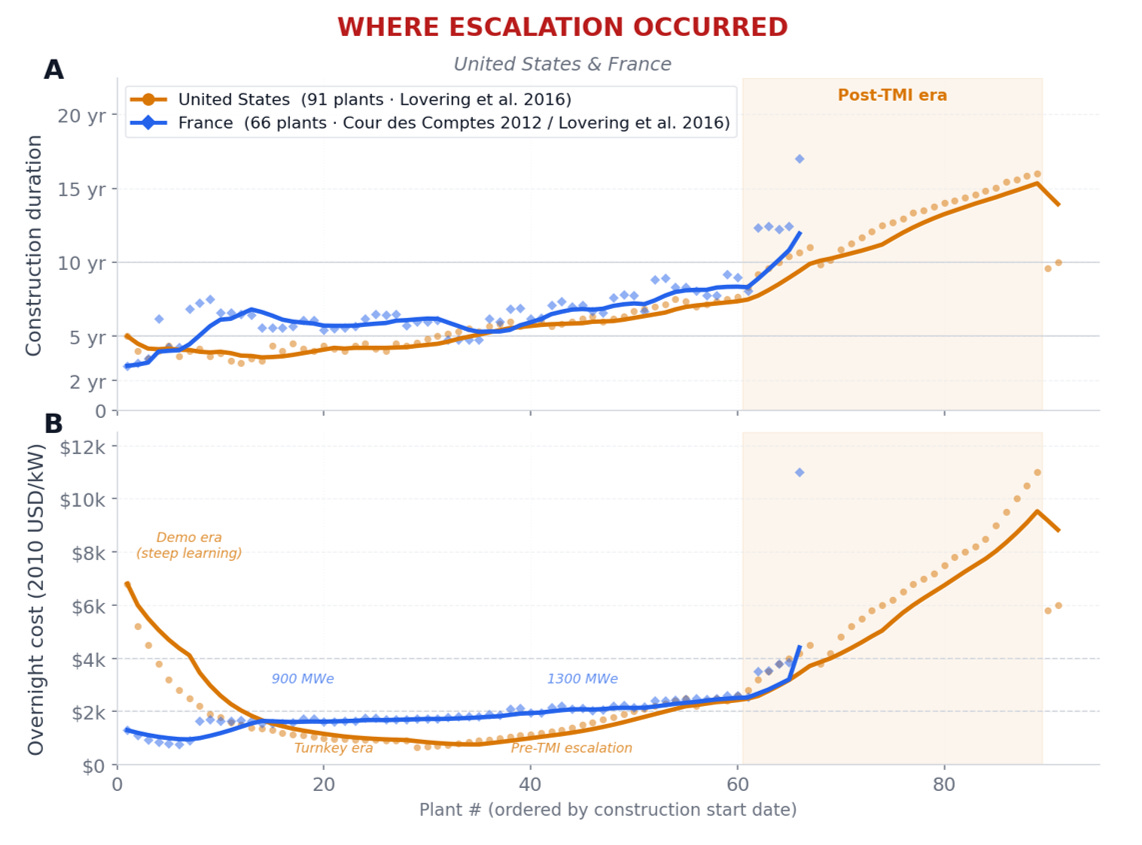
The figure above shows construction duration and costs1 for nuclear power plants built in France and the United States. U.S. plants completed in the 1960s took 40 to 60 months to build. By the late 1970s, the same reactor types routinely required 150 to 200 months; several exceeded 250 months. Lovering, Yip & Nordhaus (2016) document that overnight construction costs rose from roughly $1,000/kW in the 1960s to nearly $11,000/kW for plants completed after the 1979 Three Mile Island accident.
France tells a different story. Its 900 MWe PWR series, built repeatedly through the late 1970s and early 1980s, completed with remarkable consistency — typically 65 to 90 months — at costs rising only modestly within the series. Cost increases came at technology transitions to more complex designs.2
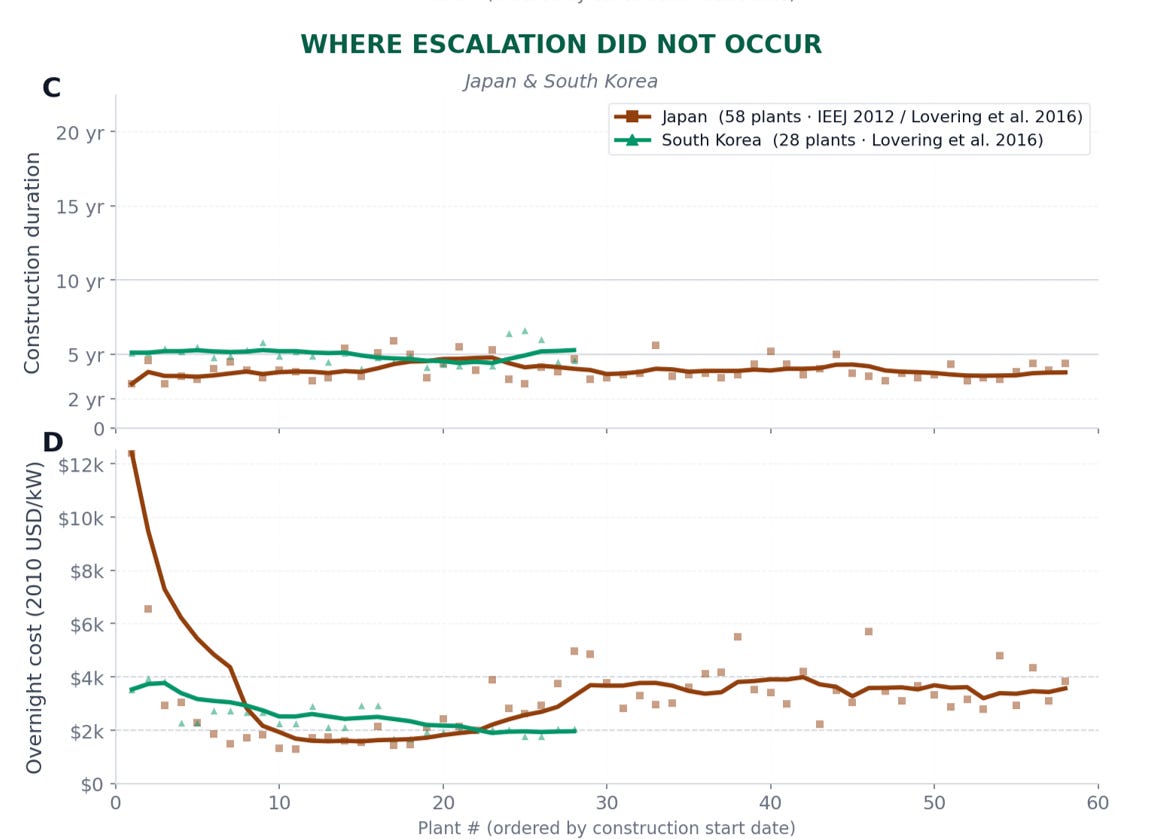
Japan and South Korea did not experience cost escalation like that in the United States. Lovering, Yip & Nordhaus (2016) provide cost data for 58 of Japan’s commercial reactors with construction starting between 1960 and 2004. Average construction duration ran about 48 months, faster than either the U.S. or France.
Japan’s earliest units — imported demonstration reactors — were very expensive: JPDR, a 10 MW GE boiling-water reactor that began construction in 1960, cost roughly $12,400/kW, and Tokai-1, a British gas-cooled design, roughly $6,500/kW. Costs then fell sharply as Japan moved to larger, increasingly domestic designs, settling in the $1,300–$2,400/kW range for reactors that began construction through the late 1970s.
From the 1980s onward, as utilities built larger 1,000+ MW units, costs rose again and became considerably more volatile — roughly $2,200 to $5,700/kW through the program’s final construction starts in 2004. Unlike the U.S., costs oscillated within that higher band rather than climbing further. But it was a real increase from the 1970s.
South Korea also does not show significant cost escalation. From the Lovering et al. data on 28 South Korean reactors, Kori-1 — an imported Westinghouse design and Korea’s first commercial unit, construction starting in 1972 — cost approximately $3,500/kW. Costs then fell for 25 years, reaching a low of $1,690/kW for Hanbit-5 and -6 (construction starting 1997) — a ~50% real decline. But the most recent reactors in the dataset, Shin-Kori-3 and -4 and Shin-Hanul-1 and -2 (construction starting 2008–2013), cost somewhat more: $1,762–$2,061/kW. These larger APR-1400 units also took longer to build — 72 to 79 months, versus roughly 50–58 months for the reactors immediately preceding them — partly reflecting delays from a 2012 parts-certification scandal that affected several plants then under construction. Even with this partial rebound, Korea’s net trajectory refelcts a ~40% reduction in overnight cost from its first reactor to its most recent.
Liu, He, Qiu & Kammen (2025) provide a plant-level cost dataset for China’s 58 operating reactors. Daya Bay (1987, built with imported French technology) came in at ~$5,180/kW. The most recent Hualong One units cost ~$1,300/kW. They argue that a systematic substitution of domestic components for expensive imports drove this reduction, which they claim has persisted.
The international comparison shows that cost escalation is not fundmental to nuclear power plant construction. Specific institutional, regulatory, and policy contexts produce escalation — and those contexts can be managed.
Five Reasons Why Some Countries Escalated and Others Didn’t
1. Mid-Construction Regulatory Change
The single best-documented driver of U.S. nuclear cost escalation is the retroactive application of new safety requirements to plants already under construction. Lovering, Yip & Nordhaus (2016) explain that reactors under construction at the time of the 1979 Three Mile Island (TMI) accident and completed afterward had median overnight costs 2.8 times higher, and median durations 2.2 times longer, than pre-TMI plants — and because overnight cost excludes financing charges, that premium reflects physical rework and redesign rather than interest costs.
Komanoff (1981) documents that the number of AEC/NRC regulatory guides governing acceptable design and construction practices grew from 21 in 1971 to 143 in 1978, and that these changes often applied to plants already under construction, sometimes requiring completed work to be torn out and redone. A specific, named episode appears in Golay et al. (1977, cited within Lovering et al.): 88 reactors then in permitting, construction, or licensing were affected by the 1971 Calvert Cliffs court decision, which forced revised Atomic Energy Commission (AEC) regulations including new back-fit requirements.
Eash-Gates et al. (2020), finds — using DOE Energy Economic reports — that 72% of U.S. nuclear cost escalation between 1976 and 1987 came from rising indirect costs (engineering, supervision, and the regulatory reviews, design review, and equipment qualification needed to meet evolving requirements), linked to a continuous decline in labor productivity driven partly by mid-construction design changes mandated by the Nuclear Regulatory Commission (NRC).3
2. Design Heterogeneity
Berthélemy & Escobar-Rangel (2015) argue that nuclear learning curves operate at the firm and design level, not the industry level. The U.S. fleet involved multiple competing vendors — Westinghouse, GE, Combustion Engineering, Babcock & Wilcox — producing dozens of distinct designs. Each plant amounted to a first-of-a-kind. Little if any accumulated knowledge transferred across vendors or designs, limiting the potential for learning by doing, and thus cost reductions.
South Korea did the opposite. The Korean Standard Nuclear Plant program, launched in 1984, froze a single design and built it serially. KHNP (Korea Hydro & Nuclear Power), South Korea’s state-owned nuclear operator, constructed consecutive units on essentially the same platform. That platform consistency produced the cost decline, as Choi et al. (2009) document in their analysis of lessons from the Korean program.
3. Supply Chain Efficiencies
China’s cost trajectory differs structurally from the others. Liu et al. find that domestic content in the nuclear supply chain predicts overnight construction cost across Chinese plants better than any other variable because Chinese-manufactured nuclear-grade components cost approximately 50% less than imported equivalents. China began with imported French technology, then systematically substituted domestic components — conventional systems first, safety-critical systems later — across three decades of industrial policy focused on standardization and cost reduction.
4. Technology Complexity Escalation
Grubler (2010) advances a more pessimistic interpretation: cost escalation in the U.S. and France reflected the technology’s developmental trajectory itself. Each new reactor generation pursued larger, more complex configurations, adding redundant safety systems that increased material intensity per kilowatt.
Lovering et al. dispute the inevitability of this pattern, pointing to Japan and Korea as counterexamples. Both constrained complexity by making incremental improvements to stable platforms rather than reinventing designs at each generational transition. A policy choice produced that outcome, not a technological inevitability.
5. Institutional Concentration of Authority
Liu et al. identify an enabling condition shared by all cost-controlling programs: centralized decision-making authority. Électricité de France, Korea Hydro & Nuclear Power, and China’s state-owned developers generate cross-project learning automatically through their integrated structures. In contrast, the U.S. has had a fragmented market — multiple vendors, multiple buyers, multiple regulatory bodies, and an adversarial licensing environment.
Lessons of Vogtle
In Georgia, Vogtle 3 and 4 — the only U.S. nuclear plants completed this century — cost approximately $35 billion total for 2,228 MW, or roughly an“overnight cost” of about $10,800/kW (in 2023 dollars, and in 2010 dollars that is $7,730/kW). The DOE Liftoff Report (2024) traces the overruns to four systemic failures: rework on components with 40–80% test failure rates, late and incomplete module deliveries, inadequate front-end engineering at construction start, and workforce inexperience from a 30-year construction hiatus. One important lesson stands out from the Vogtle experience: according to the DOE report, Unit 4 ran more efficiently and cost less to build than Unit 3 — learning-by-doing within a two-unit program. A ten-unit program of identical design would generate far steeper unit-cost declines. Learning remains possible in the U.S., but requires doing.
Lessons for U.S. Policy
The literature reviwed in this post suggests three lessons that emerge from the international comparison.
First: standardize before scaling. An important reason why France, Japan, and South Korea achieved stable or declining nuclear costs was the selection of a design that was built repeatedly. The U.S. has multiple competing advanced reactor designs, each seeking its own first-of-a-kind build. The DOE Liftoff Report estimates that a committed orderbook of five to ten identical-design reactors constitutes the minimum threshold to catalyze supply chain investment and generate meaningful learning curves. Policy can facilitate standardization, both in terms of supply (the actual design) and demand (by motivating and coordinating many projects).
Second: regulatory stability during construction is a priority. The NRC backfitting rule lets the NRC impose design changes on plants that are under construction. Regulators exercised that authority broadly after Three Mile Island, producing a 2.8× cost premium that defined a generation of U.S. nuclear economics. A statutory threshold requiring a finding of substantial hazard before regulators can impose mid-construction design changes would limit this source of cost escalation.
Third: nuclear policy is industrial policy. China’s cost decline came from a deliberate policy architecture. The U.S. went three decades without building a nuclear plant; its manufacturing base for nuclear-grade components reflects that gap. Rebuilding domestic reactor pressure vessel forging, large casting, and instrumentation-and-control manufacturing capacity requires either sustained domestic orders on the Korean model or targeted government investment to bridge the gap between current market size and the scale needed to justify private manufacturing investment. None of this requires replicating another country’s institutional policy. But it does require acknowledging that U.S. cost escalation resulted from policy choices — and that means that policy can work in the other direction.
The next post compares U.S. nuclear policy versus natural gas policy: What policy differences explain the different trajectories of natural gas and nuclear? And what lessons can we learn?